- Date
How To Measure User Engagement On Website Without Cookies
 Andrii Romasiun
Visitors decide whether to stay on your site or leave in 0.5 seconds. During that half-second window, they form a permanent impression of your layout, speed, and relevance. If the page stutters or prompts them with an intrusive pop-up, they close the tab, costing you a potential customer before they read a word.
Learning how to measure user engagement on website assets requires tracking exact user behavior from that first half-second until they close the browser. You rely on engagement metrics to confirm content relevance, identify navigation failures, and pinpoint campaigns that drive revenue.
Tracking these interactions uncovers specific friction points costing you sales. Removing these barriers accelerates revenue growth.
What User Engagement Is And Its Business Impact
Engagement measures active participation. A visitor reading an article, clicking a pricing tab, or adding an item to a cart demonstrates active interest. Passive metrics like total server hits obscure true behavior if visitors leave without taking action.
You map user intent by measuring these interactions. High engagement indicates your marketing aligns with your product. Low engagement exposes a disconnect between the ad the user clicked and the landing page they found.
The High Cost Of Poor Website UX
Poor user experience destroys engagement metrics. Average scroll depth sits at 55 percent of a page in 2026. Users skip the footer, scan the top half of the screen, and demand immediate answers.
Visitors miss core call-to-action buttons placed below that 55 percent mark. Move your primary elements above the fold. Place your main value proposition and a clear button in the top banner.
Test your layout on a slow connection. Heavy images and complex scripts cause layout shifts as the page loads. Visitors attempt to click a button, the layout jumps, and they click an advertisement instead. This friction causes session abandonment. Run a performance audit to identify layout shifts and lock your interface elements in place.
Desktop Vs. Mobile Engagement Benchmarks
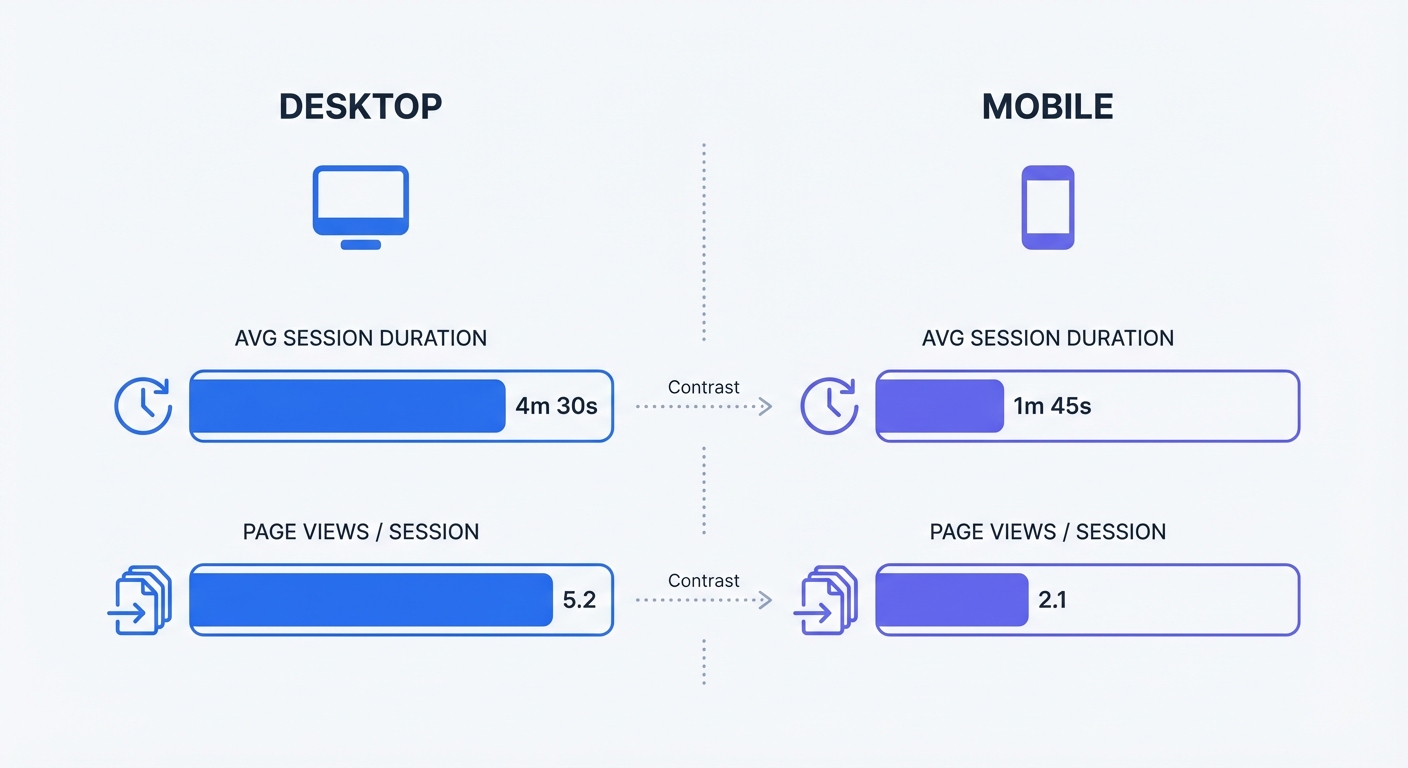
Device type dictates behavior. Desktop sessions averaged 4 minutes and 46 seconds with 4.9 page views per session in 2025. Mobile users averaged 2 minutes and 20 seconds with 4.5 page views.
Desktop visitors research complex B2B purchases and complete multi-step checkout processes, while mobile visitors seek quick answers or fast impulse purchases.
Segment your traffic by device before analyzing engagement. Combining these numbers into a single average ruins data accuracy. A 3-minute average session duration looks terrible for a desktop SaaS product but indicates excellent performance for a mobile-first local restaurant.
Open your analytics dashboard to create a filter isolating mobile traffic. Review the checkout abandonment rate for this segment. If mobile users drop off at the payment screen while desktop users convert, your mobile payment gateway requires an interface redesign.
5 Key Metrics: How To Measure User Engagement On Website
Concrete numbers validate success. Track these five performance indicators to build a complete picture of audience behavior.
Tracking Page Views And Session Duration
Page views count the total times browsers load a specific URL. This metric shows raw volume but lacks context. Ten views from one user refreshing a page mirror the appearance of ten distinct visitors finding your site.
Focus on unique visitors. This metric filters out duplicate page loads and bot traffic to show distinct human interactions.
Average session duration reveals content quality. The current cross-industry average stands at 54 seconds per page. Your copywriting works if core product pages retain visitors for more than a minute. When visitors abandon a 2,000-word technical guide after 15 seconds, the introduction failed to hook them or the formatting overwhelmed them.
Set a baseline for your ten highest-traffic pages. Record the current session duration for each URL. Rewrite the introductory paragraphs on the bottom five performers. Review the metrics in thirty days to measure the impact of your edits.
Bounce Rate Vs. Engagement Rate
A bounce occurs when a visitor leaves a page without triggering a second request to the analytics server. They read nothing else, click no links, and trigger no events. Typical website bounce rates hover between 41 percent and 51 percent.
Engagement rate tracks the opposite behavior. An engaged session lasts longer than 10 seconds, includes a conversion event, or generates multiple page views. An engagement rate above 43 percent signals healthy site navigation.
Understanding bounce rate in Google Analytics or alternative platforms helps you identify dead ends. A blog post with high traffic and a 90 percent bounce rate lacks contextual internal links. Add clear paths to related content within the first two paragraphs to retain readers.
Measuring Custom Events And Conversions
A conversion happens when a user completes a business objective. E-commerce sites count a purchase as a conversion, while B2B companies track whitepaper downloads or demo requests. Average e-commerce conversion rates range from 1.84 percent to 3.71 percent in 2026. B2B conversion rates sit higher, ranging from 2.35 percent to 4.31 percent.
Custom events track the micro-interactions leading to that final conversion. You monitor video plays, form field interactions, or clicks on outbound social links.
Map out the custom events driving your sales funnel. Identify the exact path a user takes from the homepage to a paid invoice. Set up event tracking for each step in this sequence.
| Metric | 2026 Benchmark | What It Measures | Immediate Action Step |
|---|---|---|---|
| Session Duration | 54 seconds | Content relevance and readability | Rewrite introductions on pages under 30 seconds. |
| Scroll Depth | 55 percent | Layout effectiveness | Move primary CTAs to the top half of the screen. |
| Bounce Rate | 41 - 51 percent | First impressions and navigation | Add related content links within the article body. |
| Engagement Rate | > 43 percent | Meaningful site interactions | Filter by traffic source to find low-quality referrals. |
| Conversion Rate | 1.84 - 4.31 percent | Revenue and lead generation | Simplify checkout forms to require fewer fields. |
The Blind Spots Of Traditional Web Analytics
Legacy tracking tools rely on outdated technology. They plant text files on user devices to monitor behavior across the internet. This method breaks down under modern privacy laws and browser updates.
Third-Party Cookie Deprecation
Browsers block cross-site tracking by default in 2026. Safari and Firefox eliminated third-party cookies years ago, and Chrome has finalized its restrictions. Traditional platforms use probabilistic models to estimate missing data, generating skewed reports based on incomplete signals.
Guessing user behavior wastes your marketing budget. You allocate thousands of dollars to an ad campaign because an algorithm modeled a positive return. The raw data contradicts this model, leaving you blind to the actual performance.
Consent Banner Fatigue And Data Loss
Data privacy laws mandate explicit user consent for tracking cookies. You must present a banner explaining data collection before loading analytics scripts.
Users hate these banners. Up to 41 percent of internet users reject website cookies to protect their privacy.
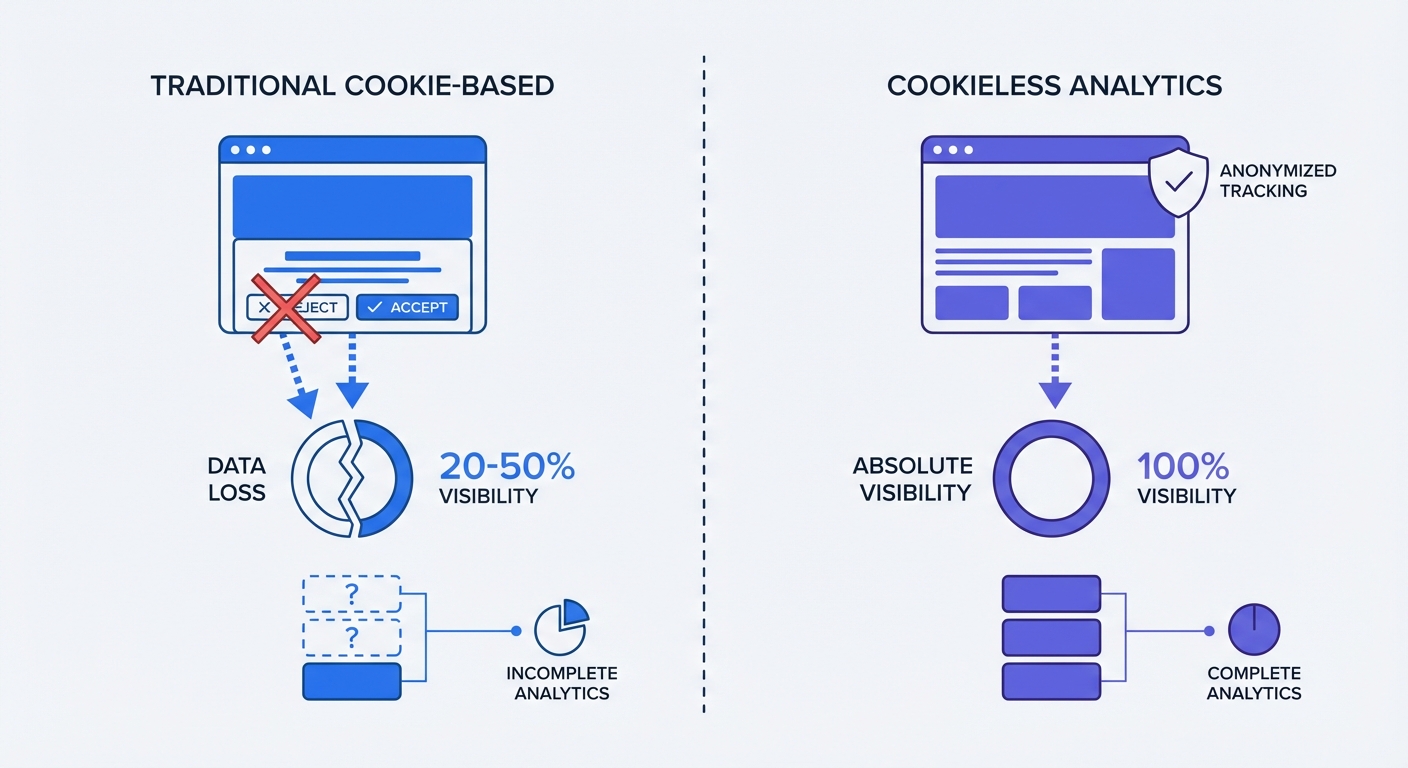
This rejection rate creates a massive data gap. Traditional platforms record nothing if a user clicks the decline button. The visitor browses your site, adds an item to their cart, completes a purchase, and leaves. Your e-commerce backend records the revenue while the analytics dashboard shows zero visits and zero conversions.
Audit your current traffic visibility today. Open your CRM or payment processor and count total orders for the past thirty days. Check total recorded conversions in your Google Analytics account for the same period. The difference between those two numbers represents your data loss gap. Optimizing marketing campaigns based on 600 recorded analytics conversions when your CRM shows 1,000 actual sales guarantees wasted budget.
Measuring Engagement Ethically With Swetrix
Removing the requirement for consent banners prevents data loss. Privacy-first tools provide full visibility without compromising user trust.
The Benefits Of Cookieless Analytics
Cookieless platforms measure unique visitors and sessions using anonymized identifiers. The software calculates a temporary hash based on a user's device and browser characteristics, which resets daily. The system tracks the user's path through your site today, but it cannot recognize that same user tomorrow or follow them to a competitor's domain.
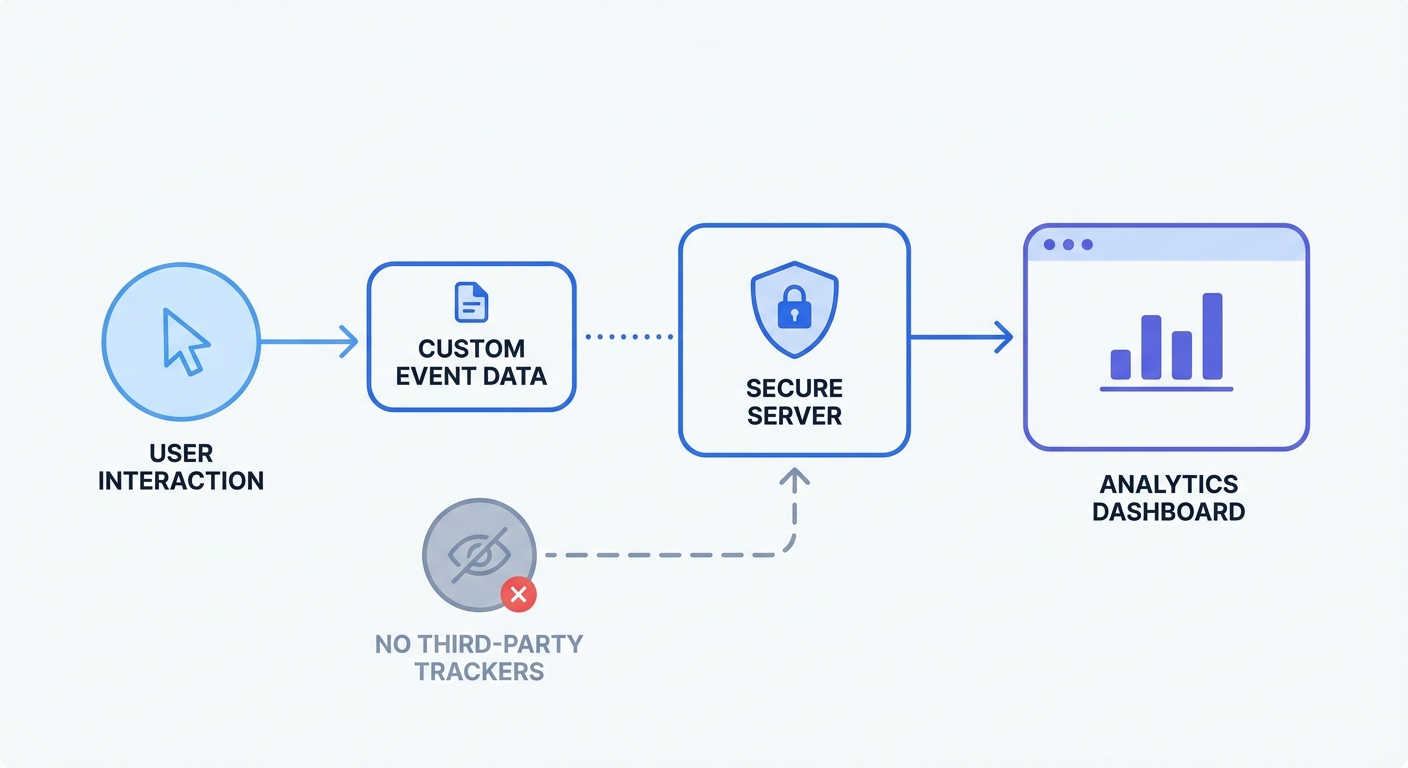
Moving away from client-side scripts improves data integrity. Sixty-seven percent of B2B companies report a 41 percent improvement in data quality after evaluating server-side tracking vs client-side methods and making the switch. Server-side tools process data on your infrastructure before sending it to the dashboard, bypassing ad blockers.
Recovering Complete Data Visibility
Swetrix operates as an open-source, cookie-free analytics platform. It collects no personal data, stores no IP addresses, and plants no cross-site trackers.
This architecture makes Swetrix GDPR, CCPA, and PECR compliant out of the box. You bypass the cookie consent banner requirement to function within legal bounds.
Removing the banner eliminates opt-outs. You capture 100 percent of your site traffic without this barrier. Every page view, session duration, and custom event registers in the dashboard. You evaluate engagement metrics based on complete data sets.
Transitioning to a cookieless tool takes five minutes. You create a project, copy a lightweight script, and paste it into the header of your website. The dashboard populates with anonymous, accurate data upon installation.
3 Actionable Best Practices To Boost Engagement Rates
Measuring metrics provides a starting baseline. Improving those numbers requires structural changes to the website architecture. Implement these optimizations to retain visitors for extended sessions.
Optimize Page Speed
Speed dictates bounce rate. Bounce rates increase by 123 percent if a page takes more than a single second to load. Users refuse to wait for heavy JavaScript bundles to parse.
Test your site's Time to First Byte (TTFB) to measure server responsiveness. Upgrade your hosting environment or implement a content delivery network (CDN) if TTFB exceeds 200 milliseconds.
Compress all media assets. Run every background image, product photo, and author headshot through an image optimizer before uploading. Serve these files in next-generation formats like WebP or AVIF.
Defer non-critical scripts. Marketing pop-ups, live chat widgets, and social media feeds block the main thread. Force these elements to load after the primary text and images render.
Integrate Contextual Content
Cross-site retargeting irritates users who view a pair of shoes on your site and see ads for those shoes on every news article they read for a month.
Replace this tactic with contextual content recommendations. Keep users engaged by offering relevant internal links based on the specific page they view.
Place a link to your API documentation within the text if a visitor reads a technical tutorial about API integration. Avoid generic newsletter pop-ups. Offer them the specific tool required to complete the task described in the article.
Map your content into clusters. A cluster consists of one pillar page covering a broad topic and several supporting pages detailing specific subtopics. Link every supporting page back to the pillar, and link the pillar out to every supporting page. This structure forces visitors to click deeper into your domain to gather complete information, increasing your pages per session metric.
Standardize Campaign Tagging
Traffic sources dictate engagement behavior. A visitor arriving from a targeted email newsletter will read a 3,000-word post, whereas a visitor clicking a viral social media meme will bounce in five seconds.
Separate these audiences to understand engagement metrics. Append tracking parameters to every outbound link you control.
Define a strict naming convention for your campaigns using lowercase letters and underscores. Never use spaces. The tag "spring_sale_2026" prevents tracking errors. A tag like "Spring Sale 26" creates fragmented data when the system URL-encodes the spaces into "%20".
Create a central spreadsheet to log every campaign URL before launch. Require the marketing team to generate their links from this specific document. Consistent tagging ensures you isolate high-performing traffic sources and cut funding to channels delivering high bounce rates.
Stop making marketing decisions based on incomplete data from blocked tracking scripts. Upgrade to Swetrix today to capture 100% of your website engagement data while maintaining legal compliance. Start your free trial to view the traffic you missed.