- Date
How to Measure Blog Post Engagement Effectively
 Andrii Romasiun
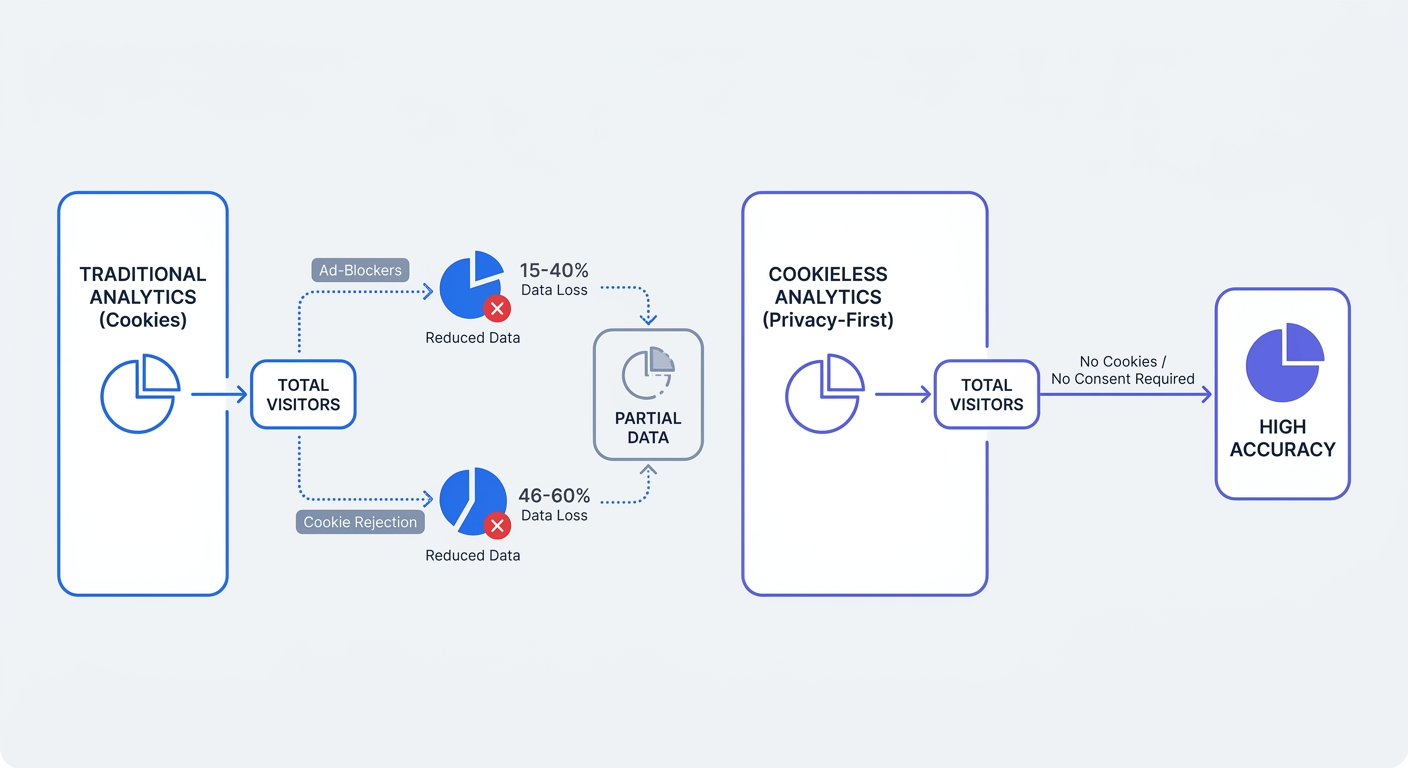
A reader clicks your latest technical guide from a LinkedIn post, reads for four minutes, copies a code snippet, and closes the tab. If they declined your cookie banner, your analytics dashboard records nothing, and that highly engaged session vanishes into a black hole of missing data. Traditional tracking tools fail to capture up to 60% of blog engagement, leaving you to optimize content based on a fraction of your audience.
Swetrix solves this blind spot by relying on cookieless, privacy-first tracking methods out-of-the-box, which means the platform logs your traffic without triggering invasive consent banners. This gives you accurate metrics to boost your content performance while visitors keep their privacy.
How to Measure Blog Post Engagement
Legacy analytics scripts load on the client side and depend on third-party cookies, which European privacy laws classify as non-essential trackers requiring explicit user opt-in. When presented with a compliant banner, a massive segment of visitors hits the decline button. Data from recent industry benchmarks shows these banners average a consent rate between 40% and 54%, so nearly 60% of your visitors reject tracking.
Browser extensions and network-level ad blockers hide another 15% to 40% of traffic, leaving you blind to the majority of your audience. A blog post might drive hundreds of high-quality readers while your reports show a ghost town, because Apple's Intelligent Tracking Prevention limits the lifespan of client-side cookies and browsers like Brave block external analytics domains by default. If your script runs from a recognizable tracking domain, the browser blocks it before the page finishes loading.
Improving blog content requires seeing more than just the users who clicked the accept button. Cookieless analytics platforms sidestep this data loss by using anonymized, rotating hashes instead of persistent tracking files. Because Swetrix stores no personal data on the user's device, it complies with GDPR, CCPA, and ePrivacy directives by default, allowing you to skip the banner and capture every pageview, scroll, and click.
The platform's hashing mechanism processes a combination of the user's IP address and user agent, encrypts it into a short-lived identifier, and discards the raw data. This identifier resets daily to prevent cross-site profiling while still connecting the pageviews of a single browsing session. Furthermore, Swetrix allows you to serve the tracking script from your own custom subdomain, which means ad blockers treat the request as first-party traffic and let it through.
Open your current analytics dashboard and compare your recorded sessions against your server logs or backend CMS views. If the gap exceeds 30%, your tracking script is failing, and switching to a privacy-friendly alternative will restore your visibility.
| Tracking Method | Data Capture Rate | Consent Banner Required | Ad Blocker Resilience | Privacy Compliance |
|---|---|---|---|---|
| Traditional Cookie Analytics | 40% - 60% | Yes | Low | Requires explicit opt-in |
| Swetrix Cookieless Analytics | 100% | No | High (with custom domain) | Default GDPR/CCPA compliance |
Tracking Active Time on Page
Session duration only tells you a visitor loaded the URL and kept the tab open, offering no insight into whether they read the text. Passive tracking starts a timer when the page loads and stops when the user navigates away, which often records a thirty-minute session for an abandoned browser tab.
Active time on page fixes this distortion by monitoring the moments a visitor interacts with the document through scrolling, moving the mouse, pressing keys, or highlighting text. When the cursor stops moving or the tab loses focus for several seconds, the script pauses the timer. Swetrix handles this heartbeat monitoring natively so the recorded metric matches the time the user spent looking at the screen.
Content consumption speeds vary based on the acquisition channel. While an informational tutorial might command several minutes of attention, MetricHQ benchmarks show B2B websites average around 82 seconds of active reading time, compared to a broader cross-industry average of 52 seconds.
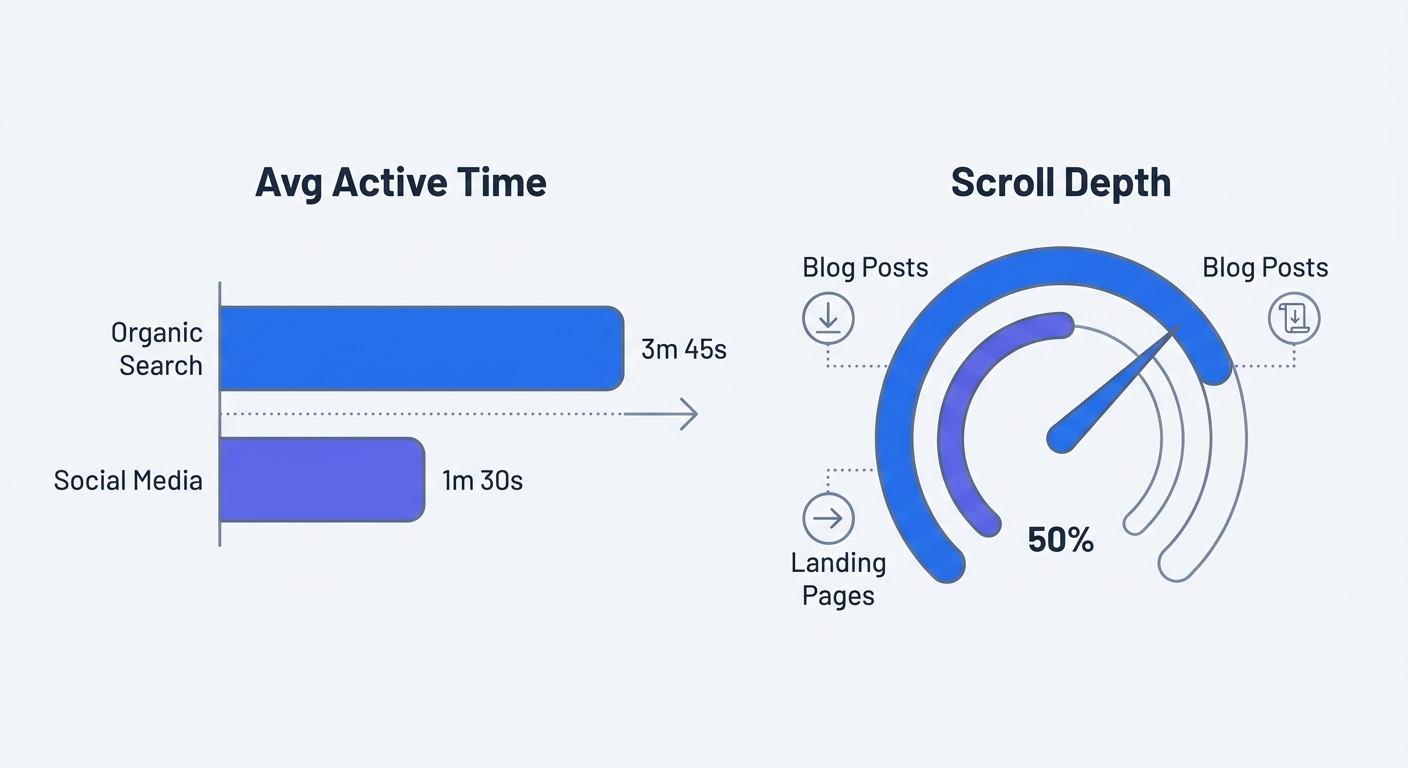
To stop relying on blended time-on-page metrics, open your analytics reports and segment your traffic by acquisition channel. If a 3,000-word tutorial shows an average read time of 40 seconds across all sources, your introductory hook is failing to keep attention. Conversely, if organic visitors read for four minutes but LinkedIn traffic leaves in 30 seconds, your social promotion strategy targets the wrong intent.
Use active read time to run a quarterly content audit by exporting your blog performance data and sorting it by pageviews. Look for anomalies where high-traffic pages show read times under twenty seconds, indicating that they rank well in search engines but fail to satisfy the search intent. Review the queries driving the traffic and rewrite the content to match what the users want. On the other end of the spectrum, identify low-traffic pages with read times exceeding three minutes. Since these posts hold high value for the few people who find them, route more internal links to these pages and increase their distribution budget.
Append UTM parameters to all your distributed links to ensure channel data sorts cleanly into your dashboard. For example, formatting a link with ?utm_source=linkedin&utm_medium=social&utm_campaign=q3_guides guarantees that your tracking platform categorizes the visitor correctly, allowing you to isolate the read time of your specific marketing efforts.
Monitoring Reader Scroll Depth
Reading requires scrolling, so a user who loads a post, reads the first paragraph, and hits the back button registers a pageview without engaging with the material. Tracking scroll depth reveals where your audience loses interest and abandons the page.
Blog posts and long-form content see higher scroll completion than transactional pages. While landing pages typically hover between 30% and 50% because their primary conversion buttons sit above the fold to encourage immediate clicks, a healthy scroll depth for an informational article sits between 55% and 70%.
If your blog posts consistently fall below a 40% scroll depth, your content structure needs revision. Readers scan before they read, so you must break up walls of text with descriptive headings, bulleted lists, and relevant images. Furthermore, move the core answer to the user's search query into the first three paragraphs instead of burying it at the bottom.
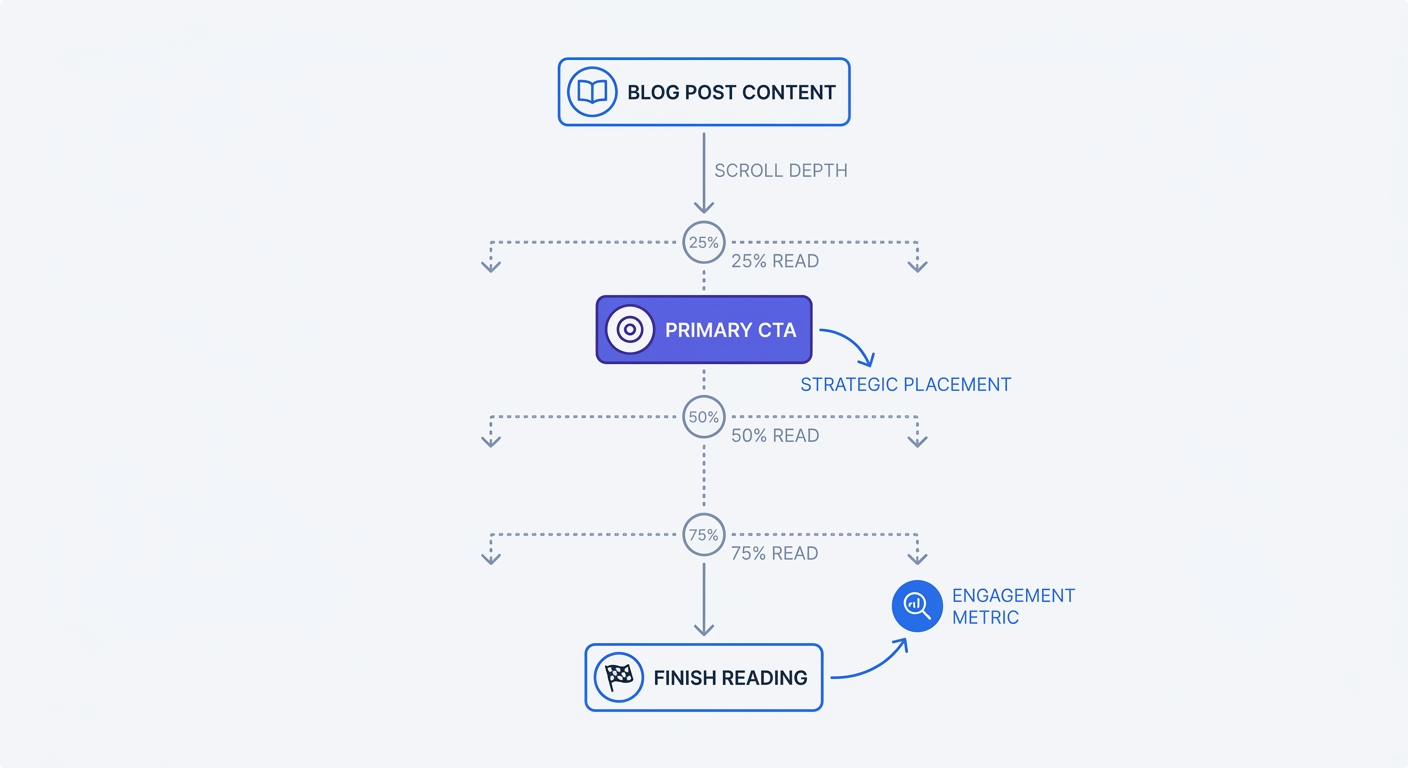
Treat scroll depth as an active measurement tool by setting up custom event milestones in your analytics platform to fire when a user reaches 25%, 50%, 75%, and 100% of the page. Swetrix handles this cookieless event tracking natively, ensuring privacy blockers do not strip the milestones out of your data.
Follow these steps to optimize your layout based on scroll data:
- Run the milestone tracking on your top ten blog posts for two weeks.
- Identify the percentage marker where the largest cohort of readers drops off.
- Move your primary newsletter signup form or product call-to-action block above that drop-off line.
- Insert related article links dynamically at the 75% mark to catch readers who finish the core material before they reach the footer.
Redefining Blog Post Bounce Rates
High bounce rates often trigger panic in marketing reviews because the metric measures the percentage of visitors who land on a page and leave without triggering a second request to the analytics server. While a 90% bounce rate on an e-commerce checkout flow indicates a broken funnel, the same rate on a blog post often means the reader found what they searched for.
Informational content naturally satisfies user intent on a single page. While general website bounce rates typically average around 47%, blog pages range heavily based on industry, typically falling between 65% and 90%. B2B SaaS thought leadership guides can bounce at 50% to 65%, whereas product pricing pages see lower rates due to higher commercial intent. A user searching for "how to format a JSON file" will read the instructions, format their file, and close the browser, registering a bounce for a successful session.
To properly evaluate performance, segment your pages by content type before looking at the bounce rate column instead of measuring your blog against your homepage or site-wide average. Because single-page sessions dominate blog traffic, measure engagement through micro-conversions instead of second-page clicks.
Configure custom events for actions that signal value:
- Clicks on inline affiliate or product links
- Interactions with a table of contents or accordion FAQ
- Form submissions for email newsletters
- File downloads for templates or cheat sheets
- Clicks on "copy to clipboard" buttons for code blocks
A visitor who spends five minutes reading a post, clicks a copy button, and closes the tab counts as a bounce in default setups, but sending an event payload to Swetrix turns that exit into a recorded success. Implementing an adjusted bounce rate by firing a custom event after 60 seconds of active reading time tells your platform that any visitor who stays longer than a minute should be reclassified as a non-bounce.
Blog posts often act as the entry point for complex multi-site journeys, where you might host your blog on Webflow but manage your product checkouts on a separate domain using Paddle or Stripe. Traditional analytics drop the session when the user crosses the domain boundary, recording a bounce on the blog and a new direct visit on the checkout page. Cookieless cross-domain tracking prevents this by passing the session identifier through URL parameters, ensuring you see the full path from the initial blog read to the final credit card charge. Set your tracking platform to treat your core domain and your checkout domain as a single property to view the true conversion path.
Adapting to the AI Shift in Content Consumption
Search behaviors shifted toward generative models, with visitors increasingly using AI chatbots for basic discovery. This means users only click through to your blog when they need deep, authoritative information, and traditional search volume will drop by an estimated 25% by the end of 2026 as these chat interfaces absorb top-of-funnel queries.
This shift creates a phenomenon where traffic volumes decrease but user intent rises. While global engagement rates across digital experiences dropped by 10% year-over-year, modern readers arrive with a specific problem, find the solution, and move on without browsing secondary pages.
Visitors arriving from Claude, Perplexity, or ChatGPT carry specific context because they already asked the basic questions. They bypassed the introductory definitions and clicked your citation link to verify a specific claim or view a detailed graphic.
Adapt your measurement strategy to track outcomes by building specific goal funnels in Swetrix for high-value actions like free trial signups or whitepaper downloads originating from blog pages. Assigning a monetary value to these micro-conversions forces your dashboard to report on content ROI instead of raw pageviews. If visitors arrive from AI prompts, move quickly through the text, and convert, a shorter time on page indicates a highly optimized user journey.
Create a dedicated segment in your analytics dashboard to filter for AI referrer traffic by tracking domains like chatgpt.com, perplexity.ai, or claude.ai. When you compare the conversion rates of this segment against your traditional organic search traffic, the AI traffic often converts at a higher percentage, demanding a shift in your writing style. To satisfy this audience, cut the fluffy introductions, front-load your original data, and provide clear formatting that AI crawlers can parse.
Instead of writing for a generic reader discovering your topic for the first time, write for the highly motivated professional trying to implement a solution. These visitors want to accomplish a task instead of reading an essay, so tracking specific event conversions over session duration aligns your analytics with the way modern audiences consume information.
Stop losing your engagement data to ad blockers and cookie banners. Swetrix provides privacy-focused, cookie-free web analytics that capture 100% of your traffic out-of-the-box. Plans start at $19/month for 100,000 events, providing full access to custom event tracking, real-time dashboards, and cross-domain setups. Start your 14-day free trial today to see how readers interact with your content.