- Date
How To Create An Analytics Report For Clients Easily
 Andrii Romasiun
Agency owners achieve better client retention than project-based firms, maintaining an 18% annual churn rate compared to 42% for project work (though this can vary significantly by service specialization, such as PPC or SEO) (Focus Digital, 2026). Long-term relationships demand consistent proof of value. Account managers demonstrate this return on investment by building structured analytics reports that connect daily agency tasks to the client's bottom line.
Agency leaders link reporting protocols to overall client retention in 70% of surveyed agencies (AgencyAnalytics, 2025). Clients cancel contracts when they fail to understand the return on their investment. Operators stop this churn by presenting clear metrics.
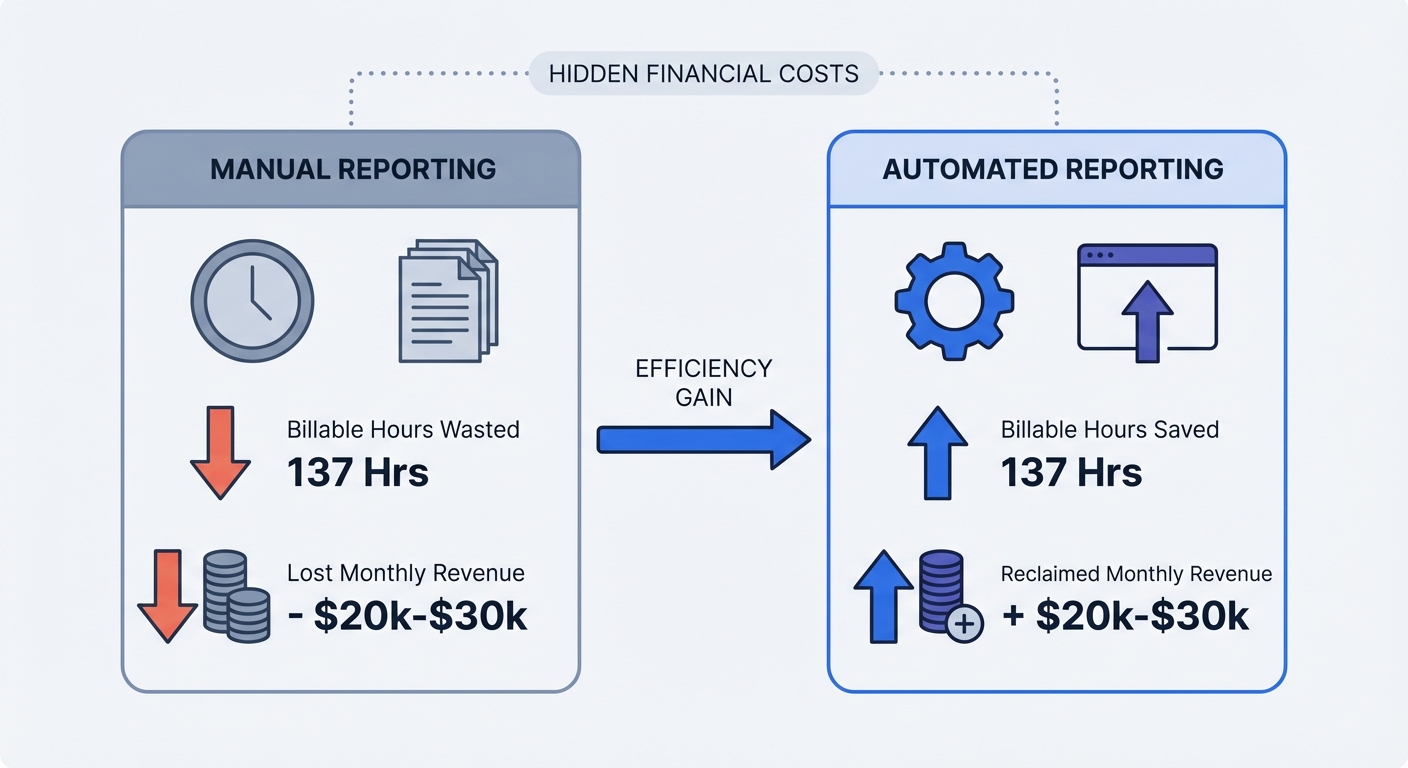
Account managers drain resources through manual data assembly. Analysts waste hours pasting numbers from five different platforms into a static spreadsheet. Agency leaders automate their reporting workflows to save an average of 137 billable hours per month (AgencyAnalytics, 2022).
You create a $20,000 to $30,000 deficit per month by losing 137 billable hours at standard digital agency rates of $150 to $224 per hour (Promethean Research, 2023). Your team wastes capacity building presentation decks instead of optimizing client campaigns. Agency founders identify tracking billable hours as their top operational pain point in 48% of cases (AgencyAnalytics, 2024).
Audit your reporting workflow this week. Reclaim this lost time by building automated data pipelines. Connect tracking tools to a centralized dashboard. Configure automatic data refreshes to reserve billable hours for strategic analysis.
The Core Elements of a High-Value Analytics Report
The What, Why, and What's Next Framework
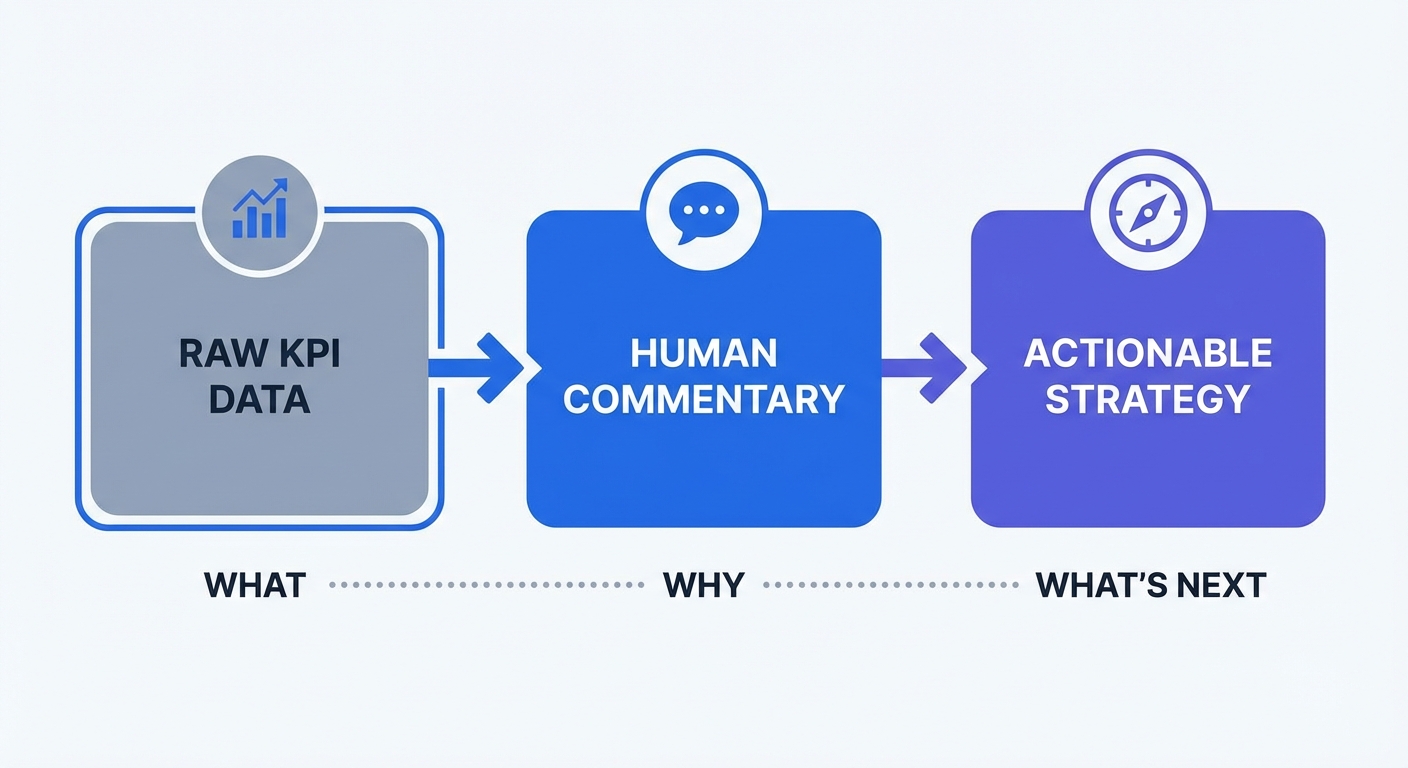
Clients find raw numbers meaningless without context. Stakeholders guess about the cause when reviewing a dashboard that shows a 15% increase in form submissions. Implement the "What, Why, and What's Next" framework to structure your analysis.
Start with the "What" by stating the objective metric change. Detail the "Why" by explaining the human context behind your agency actions. Finish with "What's Next" to outline the exact strategy pivot your team will execute next month.
| Framework Component | Purpose | Practical Example |
|---|---|---|
| What | State the raw data and KPI performance. | Cost Per Acquisition (CPA) dropped from $45 to $32. |
| Why | Explain the context behind the numbers. | We reallocated budget to local landing pages with higher conversion rates. |
| What's Next | Define the upcoming strategic action. | We are shifting an additional $1,000 from the general audience campaign to the local ad sets. |
Require your account managers to use this three-part structure for major metric changes. Account teams transform a standard SEO dashboard for clients into a roadmap for future growth by applying this method.
Focusing on Business Outcomes Over Vanity Metrics
Agency clients cannot fund payroll with total pageviews or social media impressions. Lead with business outcomes on the first page of every report. Build an Executive Summary that highlights total revenue, Cost Per Acquisition, conversion rates, and qualified leads.
Hide vanity metrics in an appendix or a secondary tab. Redirect the conversation to lead quality if a client fixates on impressions. You extract zero value from traffic volume when visitors bounce without clicking a button. Users demonstrate a mismatch between ad targeting and landing page intent through low conversion rates. Focus your commentary on bridging that gap.
Handle bad news with direct communication. Users generate fewer conversions during seasonal slumps or algorithm updates. Call out the anomaly on page one of the document. Pair the negative metric with an actionable recommendation. You build trust faster by identifying problems before the client questions the data.
Tailoring Data Complexity to Client Literacy
Stakeholders possess different levels of marketing literacy. A technical founder expects to review custom event tracking like API_KEY_GENERATED or DOCS_PAGE_SCROLL. A retail CEO wants to see top-selling products and total ad spend.
Customize your web analytics views for specific readers. Build a high-level summary for the C-suite while generating a granular technical appendix for the internal marketing team to review.
Survey your clients during onboarding. Ask them to name the three metrics that define success for their business. Build your primary dashboard around those three numbers. Strip out unrelated widgets. Account managers confuse stakeholders by presenting cluttered dashboards, and confused clients cancel retainers.
The Shift Toward Cookie-less Tracking and Privacy
Why Traditional Analytics Blockers Distort Client Data
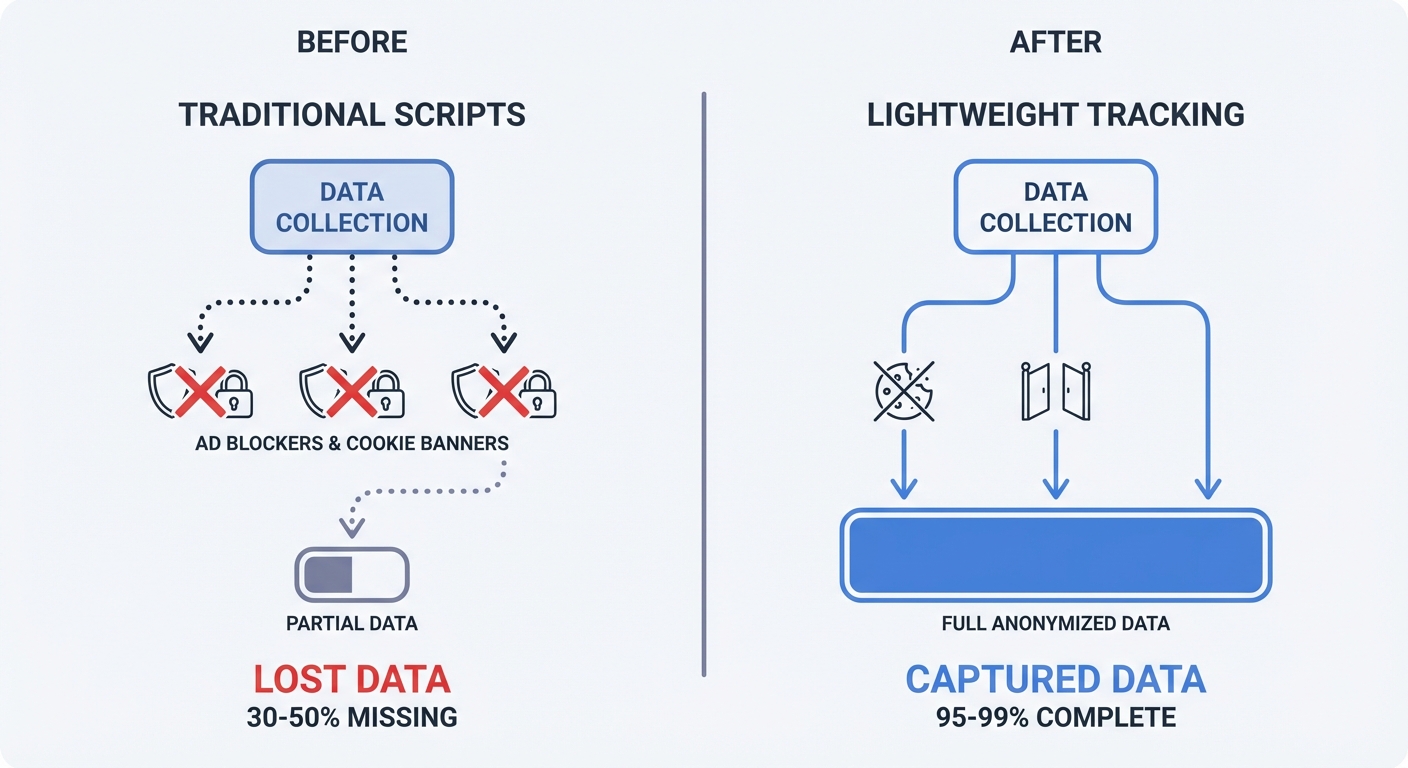
Tech companies enforce strict browser privacy protocols, forcing a shift toward cookieless tracking across B2B and ecommerce sectors (SimplifyAnalytics, 2025). Agencies rely on legacy tools built with third-party cookies and heavy JavaScript payloads. Apple and Brave block these scripts to protect user data.
You lose session data when users install ad blockers to strip Google Analytics 4 (GA4) from a page. Account managers report 500 conversions, but the client counts 650 sales in their payment processor. Users running ad blockers hide those missing 150 conversions from your tracking tools.
Replace legacy trackers with server-side setups or IP hashing. Agencies secure a competitive advantage under global privacy laws by gathering first-party data (Omeda, 2025). You guarantee complete data sovereignty for the client by deploying self-hosted, open-source software (Swetrix, 2025). Maintain control over the collection infrastructure to prevent ad blockers from breaking your metrics.
Pitching Privacy as a Premium Agency Service
Agencies face legal liability when installing invasive tracking pixels on a client website. You introduce unnecessary risk by recommending a tool that requires complex consent configurations. Choose software built for out-of-the-box compliance.
Position privacy as a distinct value-add during client pitches. Frame the transition as an upgrade to their tech stack. Account managers include Core Web Vitals, page load times, and automated JavaScript error tracking in their monthly deliverables (Swetrix, 2026).
Inform the client you plan to migrate their domain to a premium, privacy-first infrastructure. Highlight the performance gains. Users experience slower mobile rendering when browsers parse 74 KB tracking scripts. Developers accelerate load times by deploying alternatives under 6 KB to improve technical SEO scores and overall user experience (Swetrix, 2026).
Eliminating the Cookie Banner for Better UX
Users hate consent popups, and these notifications degrade website design. Regulators mandate explicit opt-ins because tools like GA4 write cookies to the local device. Visitors dismiss these notifications or abandon the page.
Switch to a GDPR-compliant solution that operates without cookies. Data analysts anonymize visitor behavior without storing persistent identifiers by using modern platforms. Site owners avoid annoying banner requirements under current legal frameworks by adopting this technical distinction.
Delete the cookie popup from the client website. You speed up the user journey by removing this friction. Clients secure better conversion rates through clean interfaces. Account managers report stronger data points during the review cycle when conversions rise.
Structuring and Automating Your Reporting Workflow
Setting Up 24/7 Dashboards vs. Monthly Summaries
Analysts create outdated documents the moment they export static PDFs. Top agencies build workflows around visual data storytelling to replace delayed data dumps (Seven Figure Agency, 2025). Clients expect access to answers mid-week.
Deploy secure cloud dashboards. Generate a read-only link for each client. Add password protection to secure sensitive revenue figures. You reduce ad-hoc data requests by providing continuous access. A client checks the dashboard to review weekend flash sale performance instead of emailing your account manager.
Group related metrics into dedicated tabs. Label the primary view "Executive Overview." Designate secondary tabs for "Traffic Sources," "Audience Geography," and "Conversion Events." Clients read their own statistics without requesting a guided tour when you establish this logical flow.
Using Annotations to Explain Data Spikes
Clients panic over unexplained data spikes. A stakeholder opens the live dashboard and sees a 40% drop in active users. Stakeholders assume the latest campaign failed when viewing sharp declines without context.
Add annotations to the timeline. You pin text notes to specific dates using most analytics platforms. Mark server outages, viral social media posts, and algorithm updates on the graph.
- Locate the date of a major site event (e.g., a 3-hour AWS outage).
- Click the specific point on your timeline widget.
- Enter a concise label: "Server downtime: 2PM-5PM."
- Save the annotation so it appears for all dashboard viewers.
You prove your agency monitors the account through proactive documentation. Account managers prevent panicked emails and demonstrate a firm grip on technical realities through these timeline notes.
Multi-Tenant Management for Growing Agencies
Account teams create chaotic workflows by managing ten separate client logins. Analysts slow down their daily optimization routines by copying credentials from a password vault. Operators scale their agencies by adopting centralized infrastructure.
Implement multi-tenant workspaces. Choose a platform that supports "Organizations" or sub-accounts under a single master login. Configure custom roles within these workspaces to protect sensitive billing details from freelance contractors.
Assign distinct permissions to internal team members. Grant a junior media buyer access to the ecommerce accounts while restricting their view of B2B clients. Invite the client staff to their specific sub-account with view-only access.
You push custom tracking templates across multiple client websites in one motion using centralized management. Operators standardize Google Analytics alternative deployments and scale operations without adding administrative overhead.
Upgrade your reporting infrastructure this week. You track accurate visitor data, bypass ad blockers, and delete consent banners using Swetrix as your primary tool. Manage all your clients from one secure multi-tenant dashboard. Start your 14-day free trial today.