- Date
How to Calculate Customer Acquisition Cost and Maximize ROI
 Andrii Romasiun
Average digital acquisition costs surged 222% between 2013 and 2022. A customer who used to cost nine dollars to acquire now costs twenty-nine—though this baseline varies widely by industry—and if you miscalculate that metric, you burn cash fast while scaling unprofitable campaigns. Customer Acquisition Cost tracks how much you spend to win a new buyer. As third-party cookies vanish and ad platforms lose targeting precision, capturing this number requires a shift in how you track data. You can use privacy-first platforms like Swetrix to maintain clear visibility into where acquired customers come from without breaking strict data protection rules.
Understanding the Basics of Customer Acquisition Cost
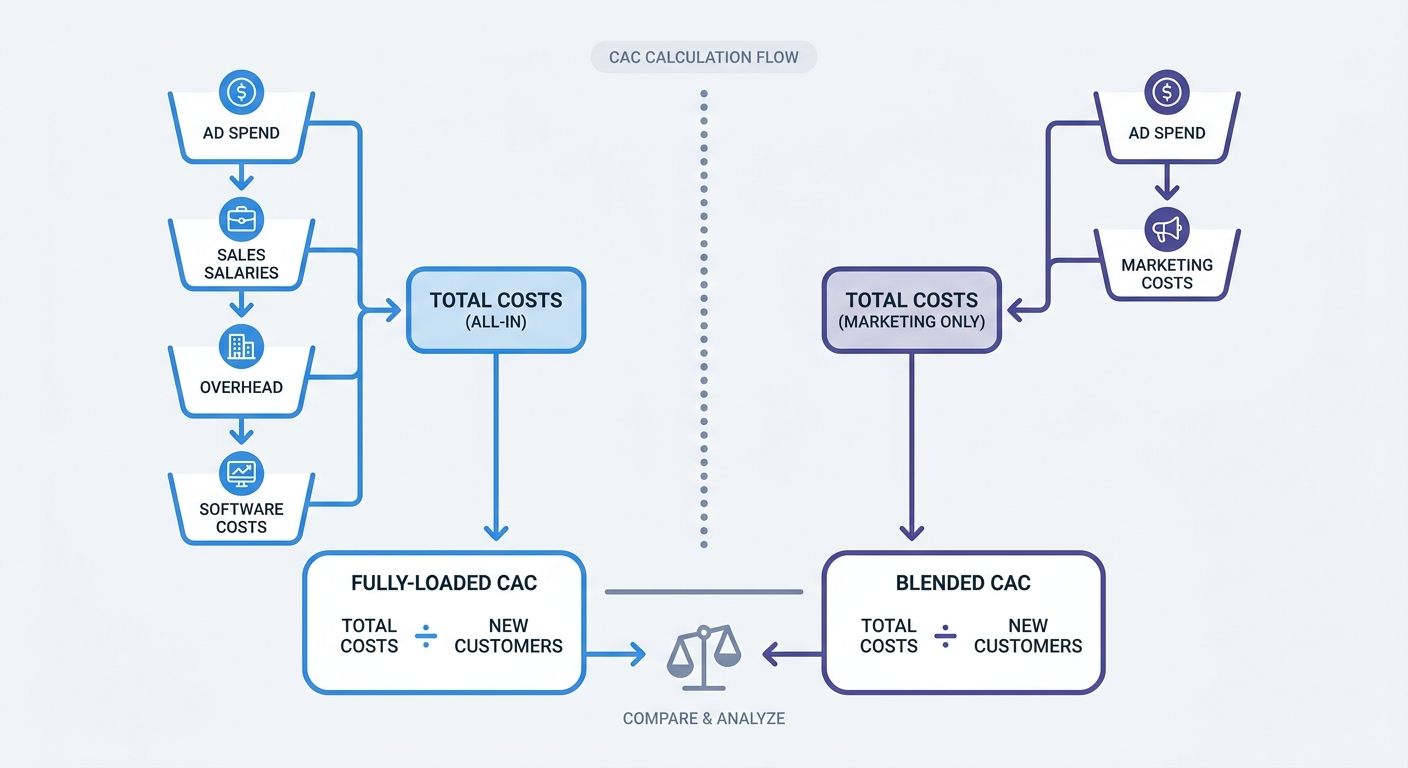
Customer Acquisition Cost measures your total sales and marketing spend divided by new customers won. This metric breaks down into two distinct versions depending on what you include in the expense column, and while you should track both, they serve different purposes for evaluating performance.
Blended CAC divides your advertising spend by your new customers. If you spend $10,000 on Meta ads and win 100 customers, your Blended CAC is $100. Because this number isolates the performance of your media buying, you can use it to compare the direct efficiency of Facebook against Google Ads or LinkedIn. While the metric looks great in marketing reports, it masks your business profitability by ignoring operational overhead.
Fully-Loaded CAC includes everything required to acquire those users. You must add sales commissions, marketing salaries, agency retainers, server hosting for landing pages, and software subscriptions to the ad spend. When you factor in a $5,000 agency fee, $2,000 in analytics tools, and $3,000 in prorated marketing salaries, that same campaign costs $20,000, which pushes your Fully-Loaded CAC to $200. Always use the fully-loaded metric to dictate your high-level business strategy, because scaling based on the blended number leads to bankruptcy by ignoring the expenses required to support ad campaigns.
| Expense Category | Included in Blended CAC | Included in Fully-Loaded CAC |
|---|---|---|
| Ad Network Spend (Google, Meta) | Yes | Yes |
| Content Promotion Boosts | Yes | Yes |
| Marketing Software Subscriptions | No | Yes |
| Freelancer and Agency Fees | No | Yes |
| Prorated Sales & Marketing Salaries | No | Yes |
| Commission and Bonus Payouts | No | Yes |
Some founders hide agency fees and software costs from their calculations to make growth look cheaper to investors, but this practice destroys internal forecasting. When you exclude the tools and personnel required to process inbound leads, you undercapitalize your sales team, causing conversions to collapse under high volume.
Step-by-Step: How to Calculate Customer Acquisition Cost
To find your acquisition cost, divide total sales and marketing expenses by the number of new customers acquired. The standard formula demands strict alignment between your inputs, requiring you to pull your expenses and your customer counts from the exact same time period. First, calculate your monthly expenses by adding up platform ad spend, content creation costs, PR, sales team compensation, and marketing software subscriptions. Then, count the gross number of new customers who signed a contract or completed a checkout in that specific month before dividing the total cost by the total customers.
If you operate a freemium model, free users do not count as acquired customers, meaning only paying customers go into the denominator. The marketing dollars spent acquiring free users get absorbed into the acquisition cost of the paid users. Factoring in these non-paying users accounts for the total expense of operating a free tier as a lead generation channel.
When your sales cycle lasts longer than a week, strict time-bound alignment breaks down. If a prospect clicks a LinkedIn ad in January but signs a contract in April, dividing April's ad spend by April's new customers produces meaningless data. B2B software companies face this misalignment frequently because enterprise deals feature sales cycles that stretch for six months and require multiple stakeholder approvals.
You can fix this misalignment by staggering your calculation window and standardizing your formula based on your average time to close. If prospects take 60 days to convert, divide March's new customers by January's marketing spend. Staggering the months maps delayed conversions back to the specific ad dollars that initiated them.
Alternatively, you can use cohort analysis to group users by the month they first visited your site. By tracking a cohort of 1,000 visitors who arrived in May and watching that specific group over the next three months, you can assign the cost of acquiring them to May's budget, regardless of when they pay. Applying this delayed calculation model prevents panic when a high-spend month yields low immediate conversions.
Industry Benchmarks and the LTV to CAC Ratio
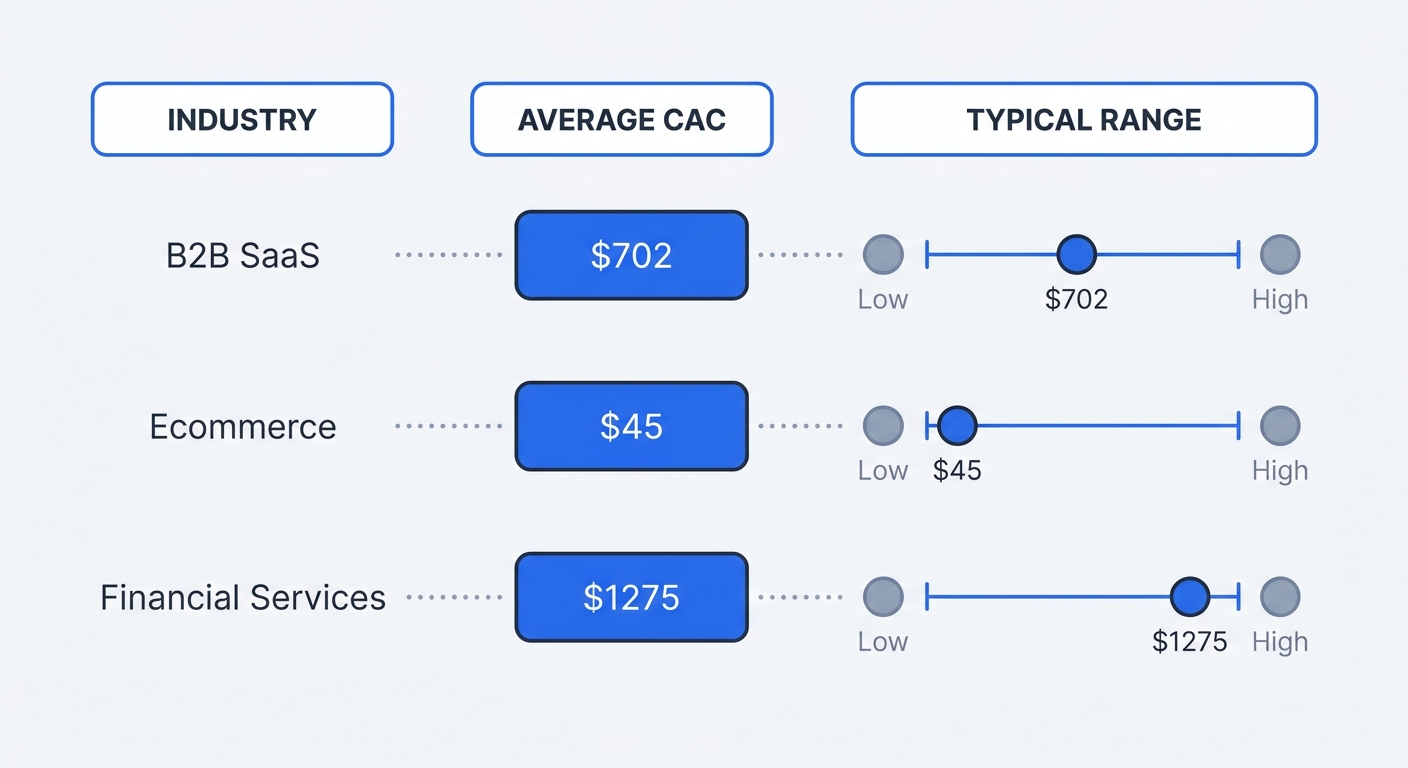
Comparing your costs to industry averages grounds your expectations. Average Ecommerce DTC acquisition costs currently sit around $45, whereas a First Page Sage report on B2B customer acquisition costs notes that SaaS companies see an average of $702 and financial services average $1,275. These numbers scale drastically based on your target audience size and content type. In the Agtech subindustry, acquiring a small business customer averages $634, but enterprise acquisitions reach $6,951. Similarly, a 2025 SaaS metrics report from Benchmarkit notes that the median software company spends $2.00 to acquire $1.00 of new annual recurring revenue.
Your cost alone tells an incomplete story until you compare it to Lifetime Value, which measures the total gross margin a customer generates over their entire relationship with your business. Calculate this figure by multiplying your average order value by your purchase frequency, and then multiplying that result by the average customer lifespan. Finally, divide this lifetime value by the cost to acquire them to find your LTV to CAC ratio.
Aim for a 3:1 ratio, meaning if a customer generates $300 in lifetime value, you should spend $100 to acquire them. Hitting this target indicates a sustainable, profitable growth engine that generates enough surplus cash to fund product development and operations.
Evaluate your current ratio to adjust your budget allocations. When your ratio drops below 1:1, you lose money on every sale, meaning you must cut underperforming channel spend and focus on retaining the customers you have. Conversely, a ratio above 5:1 signals severe under-investment in marketing. Because leaving market share on the table stunts growth, you should scale up your ad budgets, bid higher on competitive keywords, and hire more sales staff to capture that available growth. You can use the Swetrix LTV calculator to model these thresholds without building complex spreadsheets.
Measuring Channel CAC Without Third-Party Cookies
Calculating acquisition costs used to require invasive third-party tracking pixels, but those models are breaking down as privacy regulations tighten. Strict GDPR enforcement and iOS tracking changes degraded ad targeting capabilities across major platforms. This loss of visibility reduced paid targeting precision by 23%, driving average platform CPCs up by 19%.
Legacy pixels fail to fire when users deploy ad blockers or deny tracking consent, causing lost conversions in your dashboard that artificially inflate your reported metrics. For example, Meta Ads Manager might show 50 conversions for a campaign while your payment processor shows 80 new subscriptions. Calculating costs using that broken Meta data makes your acquisition cost look nearly double its real value.
Gathering first-party data protects your tracking from privacy-driven inflation. Cookieless web analytics tools capture traffic flows by recording user journeys and conversion events natively. Relying on this infrastructure helps you keep accurate counts of your traffic and conversions without depending on prohibited device fingerprinting techniques.
Filter your traffic sources to isolate channel-specific costs, rather than relying on a blended average across all platforms. Check your analytics dashboard to separate organic search acquisitions from paid social conversions, and append UTM parameters to every external link you publish. Tracking acquisition costs by individual channel reveals which campaigns deserve more budget to scale efficiently.
Proven Strategies to Lower Your Acquisition Costs
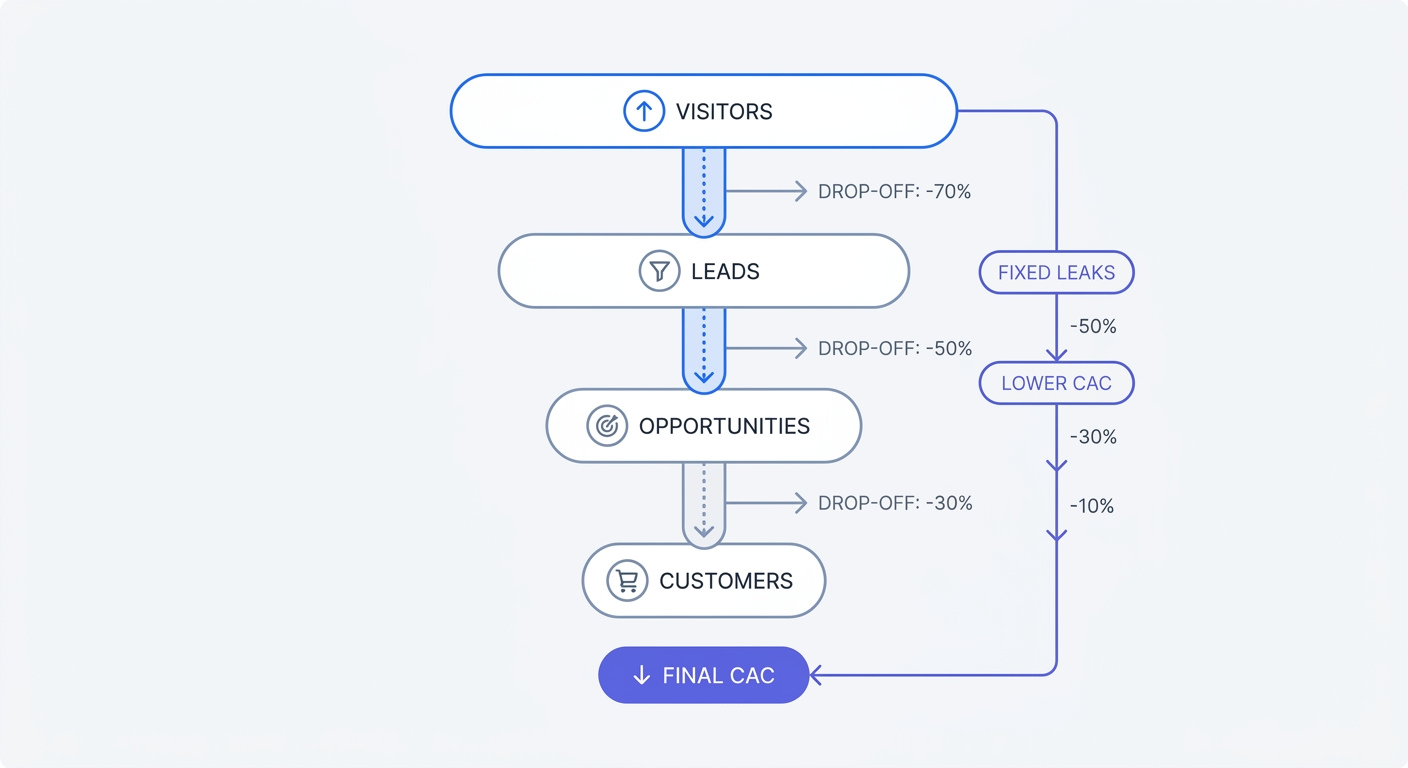
When platform costs rise, you must extract more value from the traffic you already buy. Conversion Rate Optimization provides the most direct lever to reduce acquisition costs, because fixing pipeline leaks lowers your spending ratios without cutting a single dollar from your ad budget.
Open your web analytics dashboard and map the user flow from landing page to checkout to identify specific URLs where users abandon the purchase path. If 80% of users drop off at the pricing page, simplifying your tier structure can halve that drop-off rate, which mathematically cuts your acquisition cost in half by doubling final conversions. Track these steps using custom events to see which buttons users click before leaving. Gathering these insights allows you to track user behavior without screen recording software that bogs down your site.
Shift resources toward organic and owned channels. While paid media delivers immediate traffic, the returns diminish over time. In contrast, SEO delivers an average long-term ROI of 748%—though this varies heavily by industry and content quality—compared to Google Ads at 33%. Content marketing and search engine optimization require a longer ramp-up period, but they compound, meaning a blog post written in January continues acquiring customers in December for zero additional cost.
Monitor your digital infrastructure to prevent silent technical drop-offs. Slow pages inflate acquisition costs by driving users away before the site even loads. You can deploy performance monitoring systems to track load times and cumulative layout shift. A fast website converts traffic at a higher rate, directly improving the return on your marketing investments.
Pair performance data with active error tracking. When an API fails silently during checkout, users leave and your ad spend for that click vanishes. Logging JavaScript errors in real-time allows your engineering team to fix broken forms before they ruin an entire weekend of campaign spend.
Transition to capturing first-party data for personalization by segmenting user behavior natively based on the pages they visit. Brands that build customized experiences on their own platforms achieve lower acquisition costs and higher lifetime value. Collect email addresses early in the funnel by offering valuable gated resources, which lets you retarget users through owned communication channels like email newsletters instead of paying Meta to reach them a second time.
Accurate cost calculation requires clean, privacy-compliant traffic data to identify which marketing channels drive profitable growth. Connect Swetrix Cloud to start tracking conversions, monitoring user flows, and optimizing your funnel without invasive cookies. You can build a sustainable growth engine based on accurate metrics by starting your 14-day free trial at swetrix.com/signup today.