- Date
How To Calculate Bounce Rate Without Cookie Banners
 Andrii Romasiun
A visitor opens your homepage on their smartphone. They read the main headline, scroll halfway down the screen, and close the browser tab. Your analytics platform records this action as a single-page session.
Knowing how to calculate bounce rate gives you a mathematical baseline for user engagement. Analytics dashboards show which landing pages hold attention and which pages drive users away. Modern privacy laws complicate this math. Traditional tracking tools require consent banners to monitor visitors. These popups introduce friction, causing users to abandon the site before the script fires.
To measure engagement without banner friction, marketers must understand the mathematical formulas, the impact of tracking payloads on load speeds, and the difference between session timers and page reloads.
Understanding Bounce Rate Basics
The standard calculation for bounce rate relies on a simple ratio. Marketers compare the number of visitors who view a single page against the total number of visitors who enter the website.
The Standard Calculation Formula
Open your web analytics dashboard and isolate the traffic for a specific time period. The formula divides single-page sessions by total sessions, then multiplies the result by 100 to generate a percentage.
(Total Number of Single-Page Sessions ÷ Total Number of Sessions) × 100 = Bounce Rate %
If your new product landing page receives 8,000 visits this month and 6,000 visitors leave without navigating to a second page, your bounce rate is 75%.
A single-page session means the tracking script fired once. The user arrived, triggered the initial pageview event, and triggered zero subsequent pageview events. Internal links went unclicked. The visitor avoided the checkout process entirely. The session ends when the person closes the tab, types a new URL into the browser, or hits the back button.
Bounce Rate vs. Exit Rate
Many marketers confuse bounces with exits. You must separate these metrics in your reporting to diagnose website issues.
A bounce occurs when a visitor leaves the site from the same page they entered. The entry page and the exit page are identical.
An exit occurs when a visitor leaves a domain from a specific page, regardless of prior navigation. Every bounce counts as an exit. Bounces represent a specific subset of exits.
To calculate the exit rate for a specific URL, use a different formula:
(Total Exits from the Page ÷ Total Pageviews for the Page) × 100 = Exit Rate %
Check the exit pages report in your analytics dashboard. A high exit rate on a checkout confirmation page indicates transactional success. Conversely, a high exit rate on a shopping cart page signals cart abandonment. Investigate shipping costs or broken payment gateways to plug this leak.
Universal Analytics vs. GA4: A Paradigm Shift
Google changed the definition of user engagement. When analysts compare historical data from 2022 against current metrics, the reports show a severe discrepancy.
The Flaws of the Old UA Method
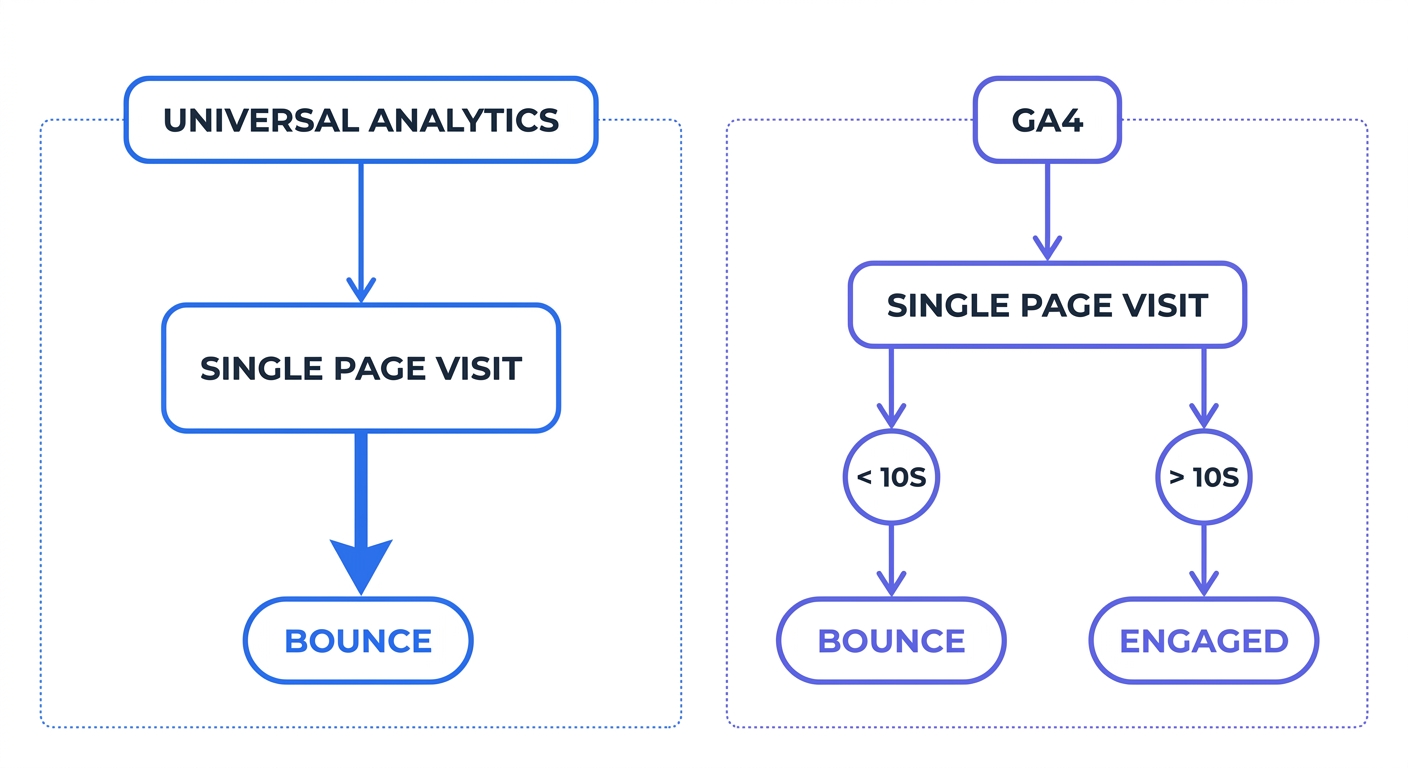
For a decade, Universal Analytics (UA) treated any single-page visit as a bounce. The system ignored time spent on the page.
A user could search for a recipe, land on a blog, read the 2,000-word post for fifteen minutes, and follow the cooking instructions. If that visitor left without clicking a second link, UA logged a 100% bounce. This strict methodology punished long-form content. Website owners saw bloated bounce numbers on pages that satisfied user intent.
GA4's Inverse Engagement Rate
Google Analytics 4 abandons the single-page rule. The updated system calculates bounce rate as the mathematical inverse of the Engagement Rate metric.
A session avoids the bounce classification if it meets any of three criteria:
- The session lasts longer than 10 seconds.
- The session includes at least one conversion event.
- The session includes two or more page views or screen views.
When marketing teams migrated to the new platform, they saw a sudden drop in bounce metrics. A user who reads a landing page for 12 seconds and leaves now counts as an engaged user.
Alter this default threshold to fit specific business models. Navigate to the Google Analytics property settings and increase the timer. For a long-form content site, change the "Adjust timer for engaged sessions" setting from 10 seconds to 60 seconds. This adjustment provides accurate reader retention baselines.
Establishing a Good Bounce Rate
Stop aiming for a zero percent drop-off. No website achieves absolute retention. Content intent dictates user behavior, making industry benchmarks the only valid comparison metric.
Averages by Industry and Device
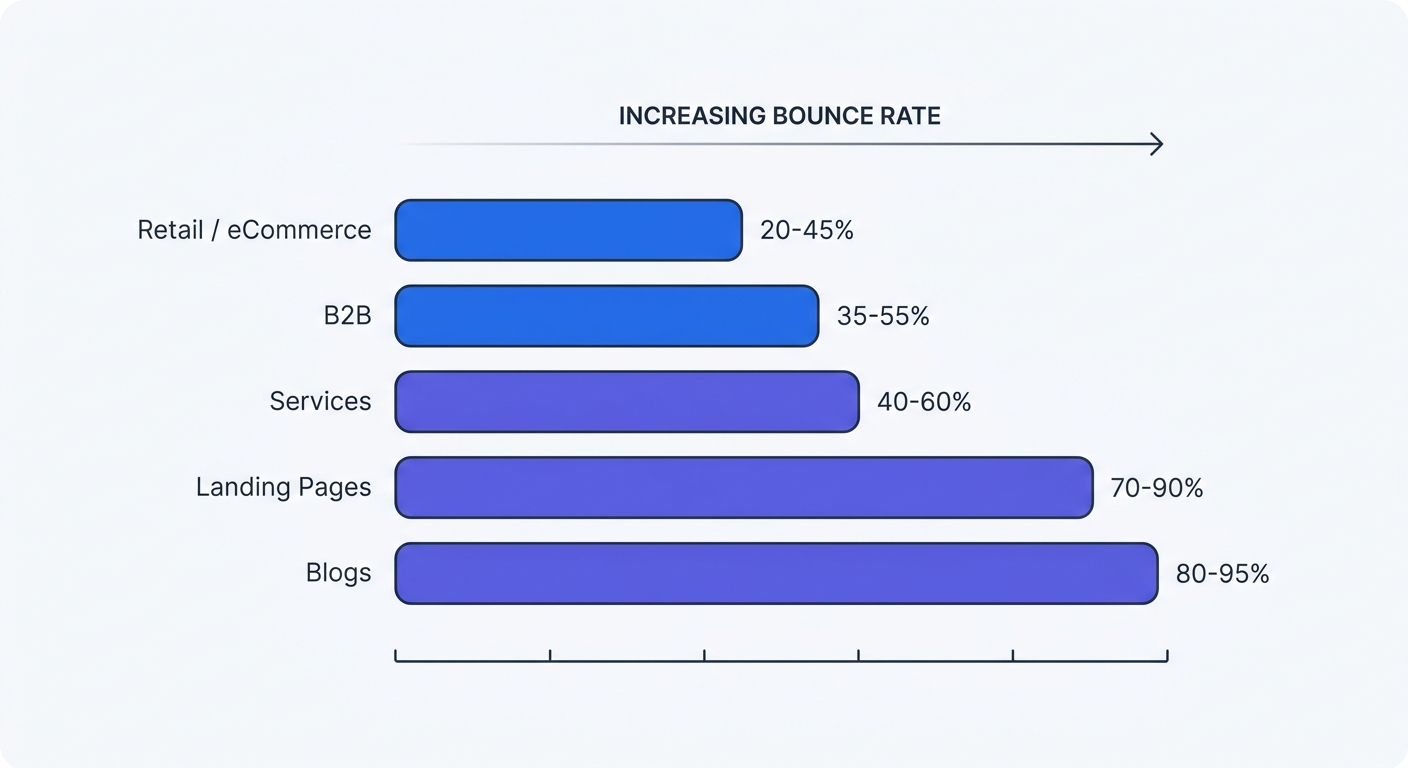
A 2024 Digital Experience Benchmark puts the global cross-industry average bounce rate at 48.7%, though actual rates range widely from 20% to 90% depending on the industry and content type. This aggregate number obscures severe variances between mobile and desktop traffic.
Mobile traffic accounts for over 60% of all website visits and runs ten points higher than desktop traffic. Smartphone users operate in distraction-heavy environments. Visitors switch tabs, answer text messages, and lose network connections. Segment reports by device to see the performance of desktop layouts versus mobile layouts.
Industry verticals operate on different baselines:
- Apparel & Footwear: Visual browsing behavior pushes the average down to 35.76%. Shoppers click through dozens of product galleries.
- Food and Beverage: Restaurants and grocery delivery sites see a 56.62% average drop-off.
- Travel Industry: Flight and hotel comparison shopping drives the average past 80%. Users open multiple tabs across different providers to check prices.
Content Intent Alters the Math
Website architecture determines how users interact with a domain. A software company builds a different layout than a news publisher.
| Content Type | Expected Range | Reason for Drop-Off |
|---|---|---|
| Retail & eCommerce | 20% - 55% | Visitors browse categories and compare products across multiple pages. |
| B2B Websites | 25% - 65% | Enterprise buyers investigate pricing, features, and case studies before leaving. |
| Landing Pages | 60% - 90% | One-page funnels push the user toward an external checkout or form submission. |
| Content & Blogs | 65% - 90% | The content satisfies search intent. The user reads the answer and exits. |
Compare a technical support page to an online store. A customer searching for a phone number wants a fast answer. The person finds the contact page, dials the number, and closes the tab. This behavior creates a 100% bounce rate despite a successful business interaction.
The Hidden Impact of GDPR and Cookie Banners
Privacy laws force website owners to ask for permission before deploying tracking cookies. This legal requirement alters data collection methods and breaks traditional analytics models.
Banner Friction and Fast Exits
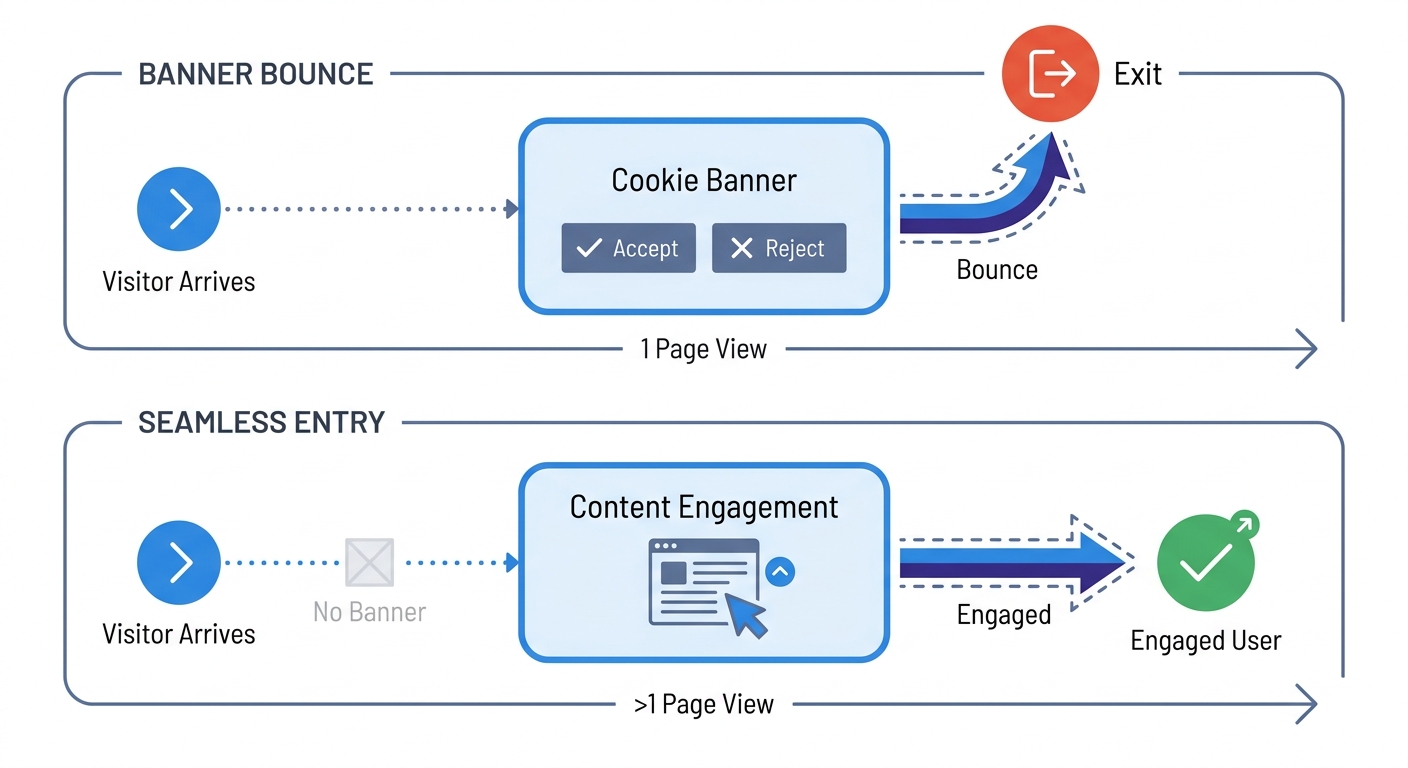
Adding a consent banner to a website introduces a physical barrier between the visitor and the content.
Mobile users face the highest friction. A popup taking up half the screen prompts fast exits. The visitor wants to read an article, not manage privacy toggles. Implementing GDPR cookie consent banners increases bounce rates by 10 to 20 percent.
These banner bounces skew retention metrics. The user rejected the tracking interface rather than the content. Marketing teams waste time rewriting landing page copy to fix a drop-off problem caused by a compliance popup.
The Blind Spot of Unconsented Traffic
Visitors who interact with the banner create a separate problem. When a user clicks "Reject All," traditional tracking scripts remain blocked.
The visitor vanishes from the database. A person might browse a domain for twenty minutes, read five articles, and fill out a contact form. Legacy analytics platforms record none of this behavior. Because a significant portion of European traffic rejects cookies, the reporting dashboard displays a severe data blind spot.
Marketers cannot trust a bounce rate calculation based on a minority subset of the audience. Users who accept cookies display different browsing behaviors than the privacy-conscious visitors who reject them. Relying on this division forces optimization decisions based on skewed, incomplete data.
To verify the scale of this missing data, compare analytics sessions against web server logs. The server records every file request. If the server shows 10,000 unique IP visits this week but the dashboard shows 4,000 sessions, the cookie banner caused the discrepancy.
How to Calculate Bounce Rate and Fix It
Marketing teams cannot fix a metric they cannot measure. First, capture the unconsented traffic. Second, optimize site infrastructure to prevent technical drop-offs. Third, segment the resulting data.
Adopt Cookieless Tracking Analytics
Eliminate banner friction by switching to a Google Analytics alternative. Platforms operating without cookies bypass the user consent requirement under GDPR.
Swetrix relies on anonymous data collection. The platform hashes visitor data to prevent personal identification. This methodology falls under the legitimate interest clause of GDPR Article 6. Because the tracking script ignores the user's local storage, administrators can remove the consent popup from the site.
Removing the banner provides two operational benefits. First, the bounce rate drops because users no longer hit a popup wall. Second, the system captures 100% of the visitor data. The dashboard calculations reflect audience size, giving analysts an accurate baseline for optimization.
Measure Single Page Applications Correctly
Standard tracking scripts fail on Single Page Applications (SPAs). Frameworks like React, Vue, and Next.js load a single HTML document. When a user clicks a navigation link, JavaScript updates the content on the screen without triggering a browser reload.
Traditional analytics rely on page reloads to fire the tracking script. A visitor might click through five different tabs in a web app. Because the browser avoids reloading, the platform logs zero subsequent pageviews. The analytics dashboard marks the session as a bounce.
To calculate bounce rate on an SPA, developers must track History API state changes. Configure the analytics platform for SPAs to listen for pushState and replaceState events. When the URL changes in the browser address bar, the tracking script fires a virtual pageview. This secondary pageview proves the user engaged with the interface, preventing the false bounce classification.
Segment Data by Traffic Source
Traffic acquisition channels dictate user patience. An aggregate calculation hides the performance of individual marketing campaigns.
Use a UTM generator to append tracking parameters to every outbound link. Build custom dashboards to isolate the bounce rate for each channel:
- Filter by Organic Search: SEO traffic seeking quick answers drops off fast. Expect higher rates here.
- Filter by Paid Social: Facebook and Instagram ads interrupt user scrolling. If the landing page fails to match the ad creative, users bounce within three seconds.
- Filter by Email Newsletters: Subscribers already trust your brand. Email traffic should display the lowest bounce rate across your dataset.
If email traffic shows a 70% bounce rate, check link destinations. The campaign directed users to a broken URL or a mobile-unfriendly page.
Optimize Page Load Speed and Script Weight
A one-second delay in page load time multiplies the probability of a bounce. Users refuse to wait for heavy media files and bloated JavaScript to render.
Review the network payload of the current analytics provider. Google Analytics 4 forces the browser to download 45 kilobytes of scripts. Stacking this tracker alongside advertising pixels, heatmaps, and remarketing tags brings the page to a halt on cellular connections.
Lightweight tools preserve Core Web Vitals. The Swetrix tracking script weighs 3.5 kilobytes. Swapping out a heavy tracker for a lightweight alternative shaves milliseconds off load times. Run key landing pages through a performance monitoring tool. Strip out any third-party script that fails to contribute to revenue or security.
Implement Custom Event Tracking
Refine the bounce definition by tracking interactive elements. A user reading a single page performs valuable actions that deserve engagement credit.
Use event tracking APIs to log targeted behaviors. Configure the analytics platform to fire an event when a user:
- Scrolls past the 50% mark of a blog post.
- Clicks the play button on an embedded product video.
- Expands an accordion menu in an FAQ section.
- Highlights text to copy a discount code.
When a single-page session includes a custom event, the visitor interacted with the business. Stop counting these sessions as a bounce. Adjusting tracking parameters to include these micro-conversions provides a clear picture of content performance.
Better data leads to better website decisions. Remove the cookie banners, track every session, and optimize page speeds. Start a 14-day free trial at Swetrix to measure bounce rate without the blind spots.