- Date
Best Dashboard Software For Sharing Web Traffic Safely
 Andrii Romasiun
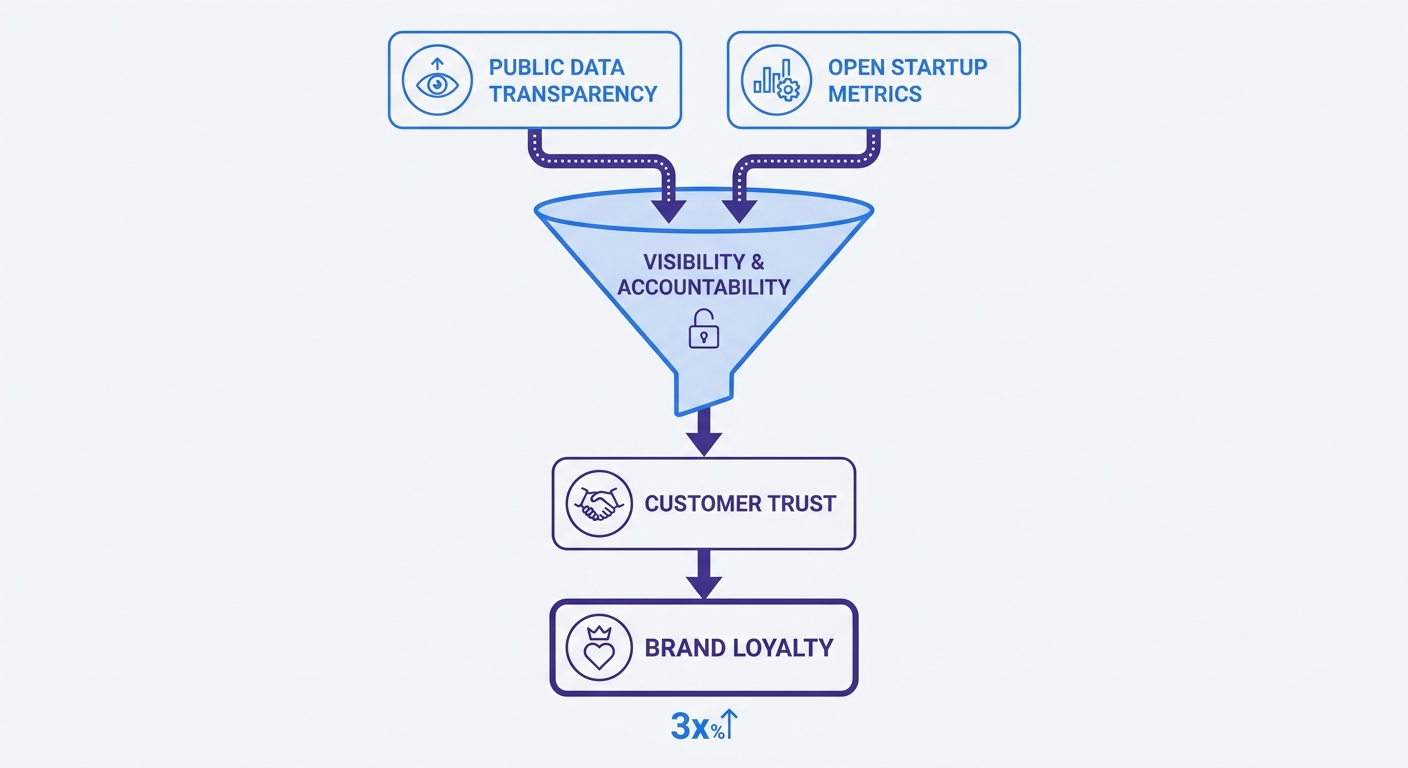
Monitoring your website traffic daily is a standard practice, but keeping those numbers hidden behind a login screen costs you an opportunity to build trust. Exposing exactly how many people visit your site and what pages they read helps users feel connected to your growth. Research into corporate data practices indicates that a vast majority of customers say corporate transparency increases their loyalty. Sharing this internal data changes the public perception of your brand.
Private data silos create a different problem for marketing agencies. Because you waste hours pulling CSV files and formatting static presentations to prove campaign performance, deploying dashboard software for sharing web traffic solves both issues. Swetrix provides a privacy-focused platform that generates live, secure links to your web analytics. This configuration allows you to automate client reporting, build community trust, and comply with global privacy laws without writing any API code.
Why Share Your Website Traffic Openly?
Hiding metrics behind a corporate wall restricts their utility, whereas shifting to public or shared analytics transforms raw data into a measurable business asset.
The Open Startup Movement
Building in public allows startups to turn metrics into a marketing channel by sharing active user counts, pageviews, and referral sources. People link to transparent businesses because published data provides concrete proof of traction. Swetrix models this approach by publishing our own usage metrics on the website, letting visitors see which features get the most engagement. Displaying these numbers ensures accountability and invites your audience to celebrate milestones alongside the team.
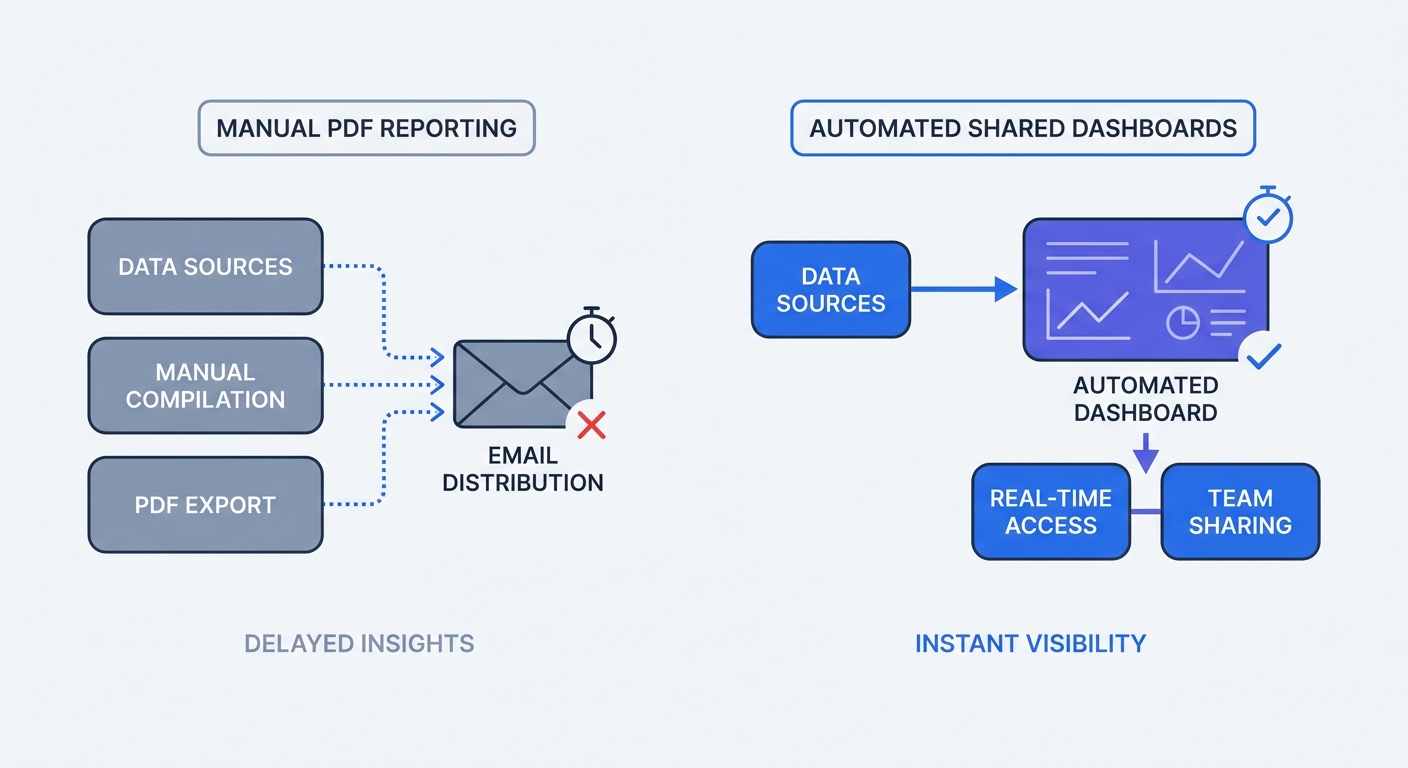
Replacing Static PDF Reports
Agency reporting tasks consume heavy administrative hours. Copying numbers from a closed platform into a slide deck separates the data from reality the moment you export it. A recent Improvado report on marketing operations shows teams burn up to 40% of their time on manual reporting and fixing broken API connections.
Replacing the slide deck with a live link gives clients access to their campaign performance on demand. They check the numbers on their own schedule, eliminating the need to spend the first week of every month formatting tables. Directing a client to a specific dashboard view answers questions about weekend promotions immediately rather than making them wait for a quarterly wrap-up.
Privacy Risks of Public Dashboards
Publishing traffic numbers introduces legal liabilities if the underlying analytics tool collects personal data improperly.
The Danger of Tracking Before Consent
Regulators actively audit websites to find third-party cookies that fire immediately on page load. Following strict enforcement of the ePrivacy Directive, authorities deploy automated crawlers to scan domains. If a crawler detects an analytics script writing a tracking ID to the browser storage without a prior click on a consent banner, the site fails the audit. Because annual GDPR violation fines routinely exceed €1 billion across the industry, sharing a dashboard powered by intrusive trackers broadcasts your non-compliance to anyone who clicks the link.
Why Cookieless Analytics Prevents Fines
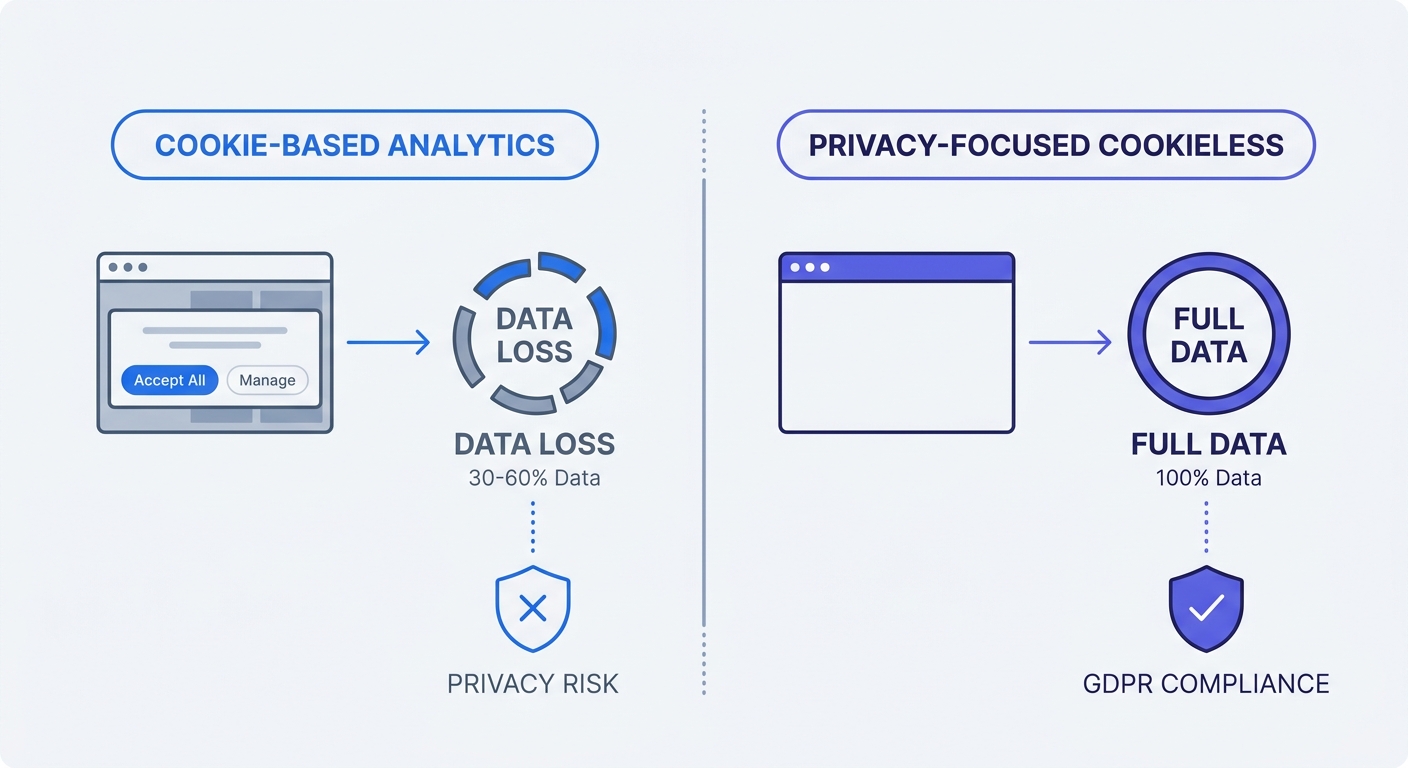
Traditional platforms like Google Analytics 4 rely on tracking cookies that require user consent. As users increasingly reject these cookies or use browser-level ad blockers, standard platforms suffer significant signal loss, which means you end up sharing a dashboard that omits over a third of your actual visitors, though this rejection rate varies by industry and audience type.
Cookieless tracking resolves both the data gap and the legal risk. Swetrix processes visits using temporary, hashed identifiers, logging pageviews and aggregating data without writing files to the user's device or storing recognizable IP addresses. Bypassing the standard consent banner ensures every visitor gets counted while your shared links display anonymized behavior patterns.
Who Benefits Most From Transparent Web Analytics?
Sharing traffic data generates distinct types of value depending on your specific business model and audience.
Software as a Service (SaaS) Startups
SaaS founders share transparent metrics to prove product-market fit to early adopters. Because prospective users hesitate to migrate workflows to a new tool out of fear the company might shut down, a public dashboard showing consistent month-over-month session growth signals stability. Demonstrating daily product usage replaces marketing claims with mathematical proof of momentum.
Marketing and SEO Agencies
Agency churn increases when clients fail to understand the provided value. Forcing a client to ask for an update on an SEO campaign damages their confidence, whereas handing them a shared dashboard link on day one establishes authority. Watching organic traffic climb in real time keeps them engaged. Combining this visibility with an ROI calculator turns abstract traffic increases into clear revenue figures.
Content Publishers and Bloggers
Monetizing a blog through sponsorships or direct ad sales requires proving your reach to advertisers. Sending a media kit with static, outdated traffic numbers damages credibility. Embedding a live analytics dashboard link directly into your sponsorship page eliminates back-and-forth email negotiations, allowing the sponsor to click the link, verify daily readership, and buy the ad slot.
Key Features of Shareable Dashboards
Not all data belongs in public view, which means setting up a shared dashboard requires tight control over the specific metrics loaded on the screen.
Real-Time Aggregate Metrics
Public and client-facing reports require a focus on top-level trends like total sessions, unique visitors, top referring domains, and conversion rates. Skipping granular user-level event trails prevents the exposure of confidential transaction details. Sticking to aggregated numbers aligns with GDPR data minimization rules because you only collect and share the specific metrics required to demonstrate performance.
Tailoring Data to Your Audience
An effective dashboard highlights a maximum of 15 key performance indicators to prevent fifty different charts from overwhelming the viewer. Breaking your shared dashboard into three logical sections of acquisition, engagement, and conversion structures the information clearly.
Display total sessions and top referrers for acquisition, track average time on page and bounce rate for engagement, and highlight macro-goals like form submissions for conversion. Executive clients prefer this high-level traffic growth, but internal teams require specific views detailing exact campaign performance. Configuring distinct dashboard views for different stakeholders keeps the data relevant for each group.
Filtering Bot Traffic for Accurate Public Numbers
Public dashboards lose credibility when sudden spikes of bot traffic inflate the numbers. Standard platforms struggle to differentiate between genuine readers and automated scrapers, so Swetrix automatically filters known bot IPs and server-farm traffic at the network level. Verifying the legitimacy of the request before logging the pageview ensures the shared dashboard reflects human interest. This filtering prevents you from having to explain a 10,000-visit spike from a random data center to a confused client.
Top Dashboard Software For Sharing Web Traffic
Selecting the right platform depends on who needs to see the data and your available setup time. A heavy business intelligence tool requires a dedicated data engineer, while a lightweight analytics platform works out of the box.
Swetrix: The Privacy-First Leader
Swetrix operates as an open-source, cookie-free web analytics platform designed for secure data sharing. You can self-host the software or use the managed cloud version starting at $19 per month for 100,000 events. Generating a shared dashboard requires one click to flip a toggle in your project settings, prompting the system to create a secure URL.
Because the tracking pixel collects zero personal data, exposing metrics to third parties bypasses privacy law violations. The interface allows you to password-protect specific project views, track custom events, monitor page performance, and attribute revenue. If you need a Google Analytics alternative treating data transparency as a primary feature, Swetrix fits the requirement.
Grafana and Tableau Public
Grafana provides developer observability for engineering teams monitoring server uptime, CPU usage, and application logs. Piping web traffic into it requires complex queries, making the interface cater to backend infrastructure rather than marketing analytics.
Tableau Public handles large datasets and intricate visual storytelling for organizations publishing interactive election maps or demographic studies. Building a daily traffic report in this software requires significant data cleaning and a steep learning curve, meaning neither tool serves as a simple drop-in replacement for a standard web analytics dashboard.
Coupler.io and Improvado
Platforms like Coupler.io function as data aggregators that pull API feeds from Meta Ads, Google Ads, Stripe, and your CRM into a central warehouse. Blending ad spend metrics with downstream sales data calculates customer acquisition costs across multiple channels. Because these platforms do not track website traffic natively, capturing pageviews requires a separate analytics provider before the behavior data enters a centralized report.
| Platform | Best Use Case | Setup Complexity | Tracks Traffic Natively |
|---|---|---|---|
| Swetrix | Client reporting, open startup metrics, privacy compliance | Low | Yes |
| Grafana | Server monitoring, time-series infrastructure metrics | High | No |
| Tableau | Deep data storytelling, massive relational datasets | High | No |
| Coupler.io | Aggregating multiple external ad platform APIs | Medium | No |
How to Set Up Your Shared Analytics Dashboard
Launching a public or client-facing dashboard demands a methodical approach to data visibility.
1. Define Your Audience and Scope
Determine the audience for the shared link before selecting metrics. Open startups demonstrating steady growth to potential customers should include total sessions, active users, and top-performing blog posts. Excluding internal metrics like server error rates or specific geographic data prevents competitors from gaining an edge in regional advertising.
Dashboards built for clients require a focus on controlled traffic. Filtering the default view shows visits tagged with specific UTM parameters from active campaigns.
2. Connect Your Tracking Pixel
Collecting data safely precedes sharing it. Adding the Swetrix tracking script to the <head> section of your website installs a payload of a few kilobytes that loads asynchronously to protect website performance. Deploying the tag populates the dashboard with live traffic data.
3. Configure Privacy Filters
Navigating to project settings lets you exclude internal traffic by adding office IP addresses to the blocklist. This step prevents your team's visits from inflating the public numbers. Setting up a custom domain for tracking bypasses browser privacy blockers targeting generic third-party analytics domains.
4. Track Custom Events for Public Milestones
Basic pageviews provide incomplete metrics, so configuring custom events tracks specific interactions like newsletter signups, video plays, or file downloads. Swetrix logs these events without complex tag manager setups. A shared dashboard displaying a climbing graph of direct newsletter subscriptions provides concrete proof of audience engagement.
5. Generate the Secure Link
Opening your Swetrix project dashboard and navigating to the sharing options in project settings allows you to enable the public link feature, prompting the system to output a unique URL.
Assigning a strong password to the link protects data belonging to specific clients. Embracing transparency involves copying the open link and embedding it into the footer of your website or linking it from the company's "About" page.
6. Automate the Delivery
Replacing manual spreadsheet updates with an automated monthly email template delivers the password-protected link alongside a brief text summary of the top three trends. Clients learn to check the live dashboard for numbers, returning hours of administrative work to your schedule.
Replacing static PDFs and complex login screens with transparent data builds lasting customer trust and eliminates manual reporting overhead. Start sharing your traffic metrics securely today with a 14-day free trial at Swetrix.