- Date
The Best Open Source Website Performance Monitoring Tools
 Andrii Romasiun
A one-second delay in page load time causes an average 7% drop in e-commerce conversions, though this impact varies across different industries. Find the best open source website performance monitoring tools to improve Core Web Vitals, fix load speeds, and boost site conversions. Mobile users abandon sites taking longer than three seconds to load. Swetrix tracks these drop-offs through cookieless Real User Monitoring (RUM).
Marketers review traffic and bounce rates in the current analytics dashboard, missing the technical friction causing those bounces. Marketing teams burn ad spend driving users to mobile pages taking four seconds to render. Resolving the disconnect requires tools linking user behavior to server response times. Developers solve this visibility problem using open source platforms. Self-hosting tracking scripts bypasses ad-blockers and gives engineering teams complete control over the entire data pipeline.
The Urgent Need for Website Performance Monitoring
The Connection Between Speed and Conversions
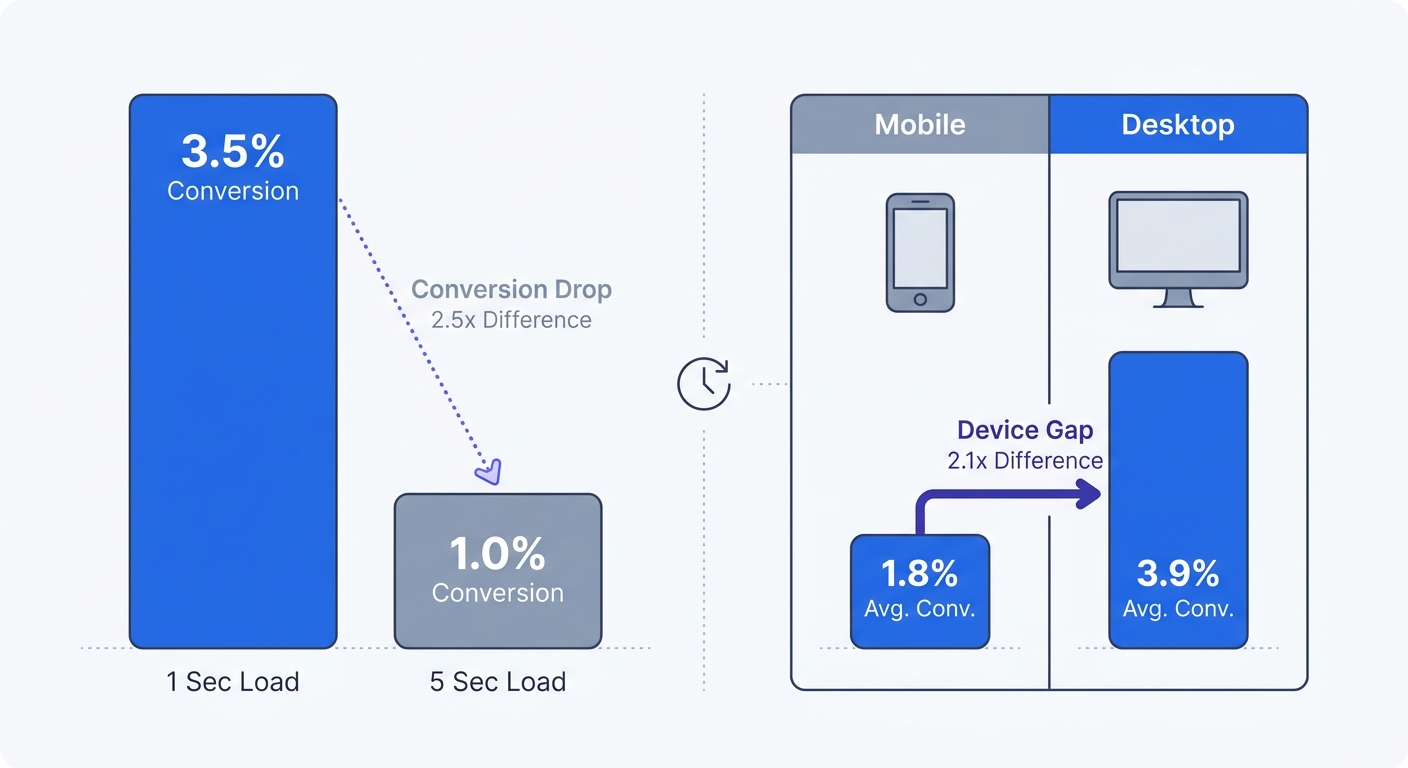
Smartphone users demand faster experiences, with 47% expecting load times under two seconds before abandoning the session. Sites hitting the one-second mark achieve conversion rates 2.5 times higher than their five-second counterparts. Users evaluate trust based on visual stability and responsiveness. Slow database queries cause high Time to First Byte (TTFB). The browser pauses while the server assembles the HTML document, leaving the user staring at a blank white screen. Visitors interpret this delay as a broken link and tap the back button.
Audit the current Largest Contentful Paint (LCP) scores today. This metric measures the render time for the main image or text block. Google engineers consider an LCP under 2.5 seconds acceptable, yet a minority of global websites meet this threshold. Check server response times inside the analytics platform to locate geographic regions experiencing high latency. Moving asset delivery to an edge network or CDN closes the geographical distance between the server and the visitors.
The Shift to Interaction to Next Paint (INP)
On March 12, 2024, Google deprecated First Input Delay (FID) and replaced it with Interaction to Next Paint (INP) as a stable Core Web Vital metric. The Google Chrome Team established INP to measure responsiveness by evaluating all interactions over a page's lifecycle. FID measured the initial input delay, ignoring the time the browser spent running event handlers and presenting the next visual frame. INP tracks every tap, click, and keyboard input across the entire session to log the longest single delay the user experiences.
Complex JavaScript applications struggle with INP scores. When a user clicks an accordion menu, the browser pauses to execute a massive bundle of third-party scripts. This freezes the user interface, and the delay between the click and the visual update determines the INP latency.
Check Google Search Console for INP warnings to prevent poor scores from downgrading organic search visibility. Next, profile the site in Chrome DevTools using the Performance tab to locate main thread tasks exceeding 50 milliseconds. Developers must break these long JavaScript tasks into smaller chunks. Defer background syncs and non-critical tracking pixels until the main content finishes rendering.
Choosing Open Source for Performance Tracking
Beating the Cookie Blocker Problem
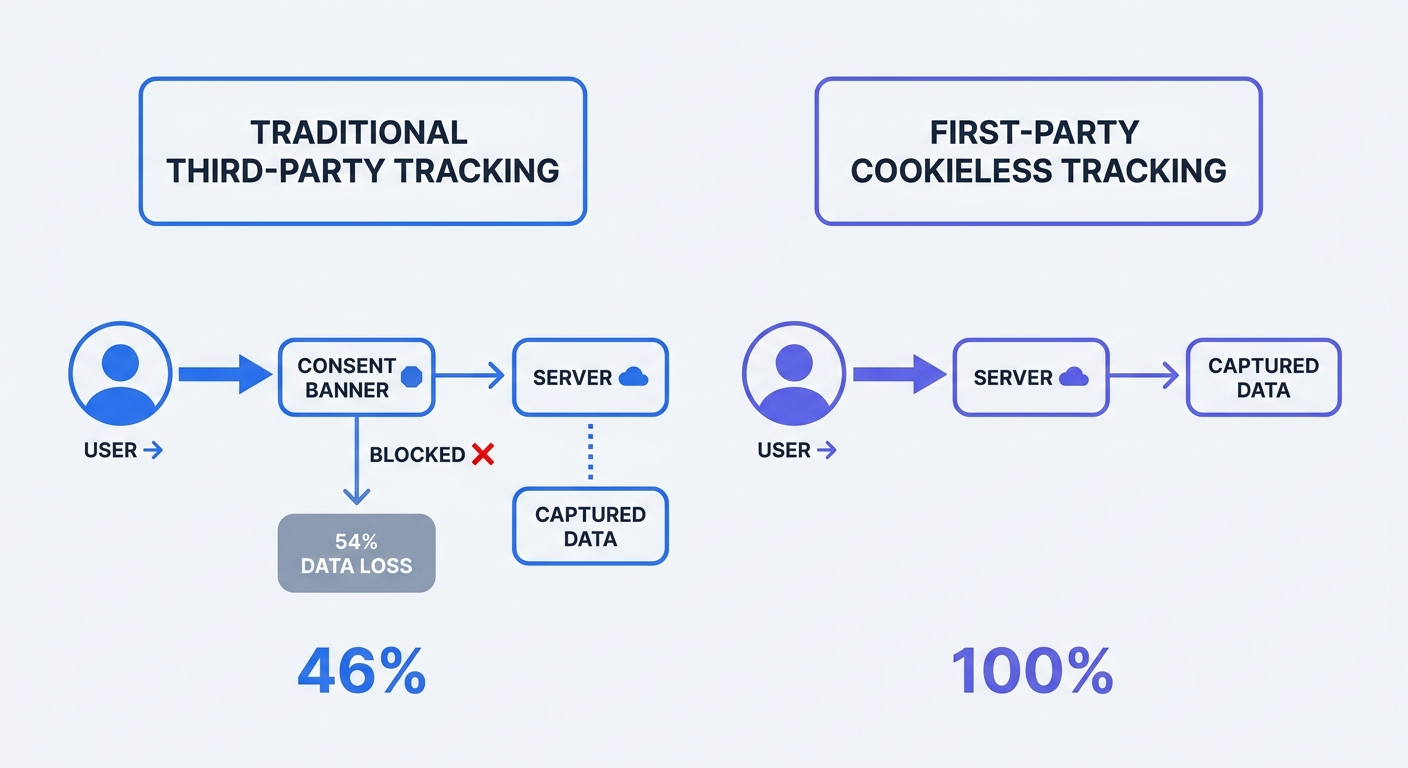
Average EU marketing cookie consent rates hover around 46%. Traditional analytics platforms fail to load without this consent, causing brands to lose visibility on over half their traffic. Marketing teams make budget decisions based on fragmented datasets.
Browser extensions like uBlock Origin and native iOS privacy features block commercial tracking domains. Hosted analytics scripts fail to execute in these environments. Marketers see artificial drops in direct and organic visits as a result.
Engineering teams fix this blind spot with open source analytics. Self-hosting on a first-party subdomain bypasses browser ad-blockers. Developers configure the tracking script to run through analytics.yourdomain.com. The browser sees a request to the origin server instead of a third-party advertising network.
Adopt a cookieless, open-source setup to close the data gap while maintaining legal compliance. Cookieless platforms hash incoming IP addresses with a rotating salt generated each day to create an anonymous session identifier that resets at midnight. This method persists tracking across page views without storing personal data on the user's hard drive.
Data Ownership and GDPR Compliance
Hosted commercial analytics log raw IP addresses on third-party servers. Storing this information breaks GDPR rules without explicit consent, prompting regulators to issue fines for sending EU citizen data to unauthorized foreign servers.
Compliance teams require data sovereignty to keep user metrics on hardware the organization controls. Open source tools employ privacy-by-design architectures to anonymize user data before it hits the database. System administrators must drop cross-site tracking mechanisms and maintain total control over performance log access.
Host the analytics database on European servers and verify the cloud provider guarantees data residency within the target region. Security teams run compliance checks on the data pipeline to ensure no Personal Identifiable Information (PII) enters the analytics tables. Configure the tracking snippet to respect the Do Not Track (DNT) header and enforce user privacy preferences at the network level.
Top Open Source Website Performance Monitoring Platforms
Swetrix: The All-In-One RUM & Analytics Winner
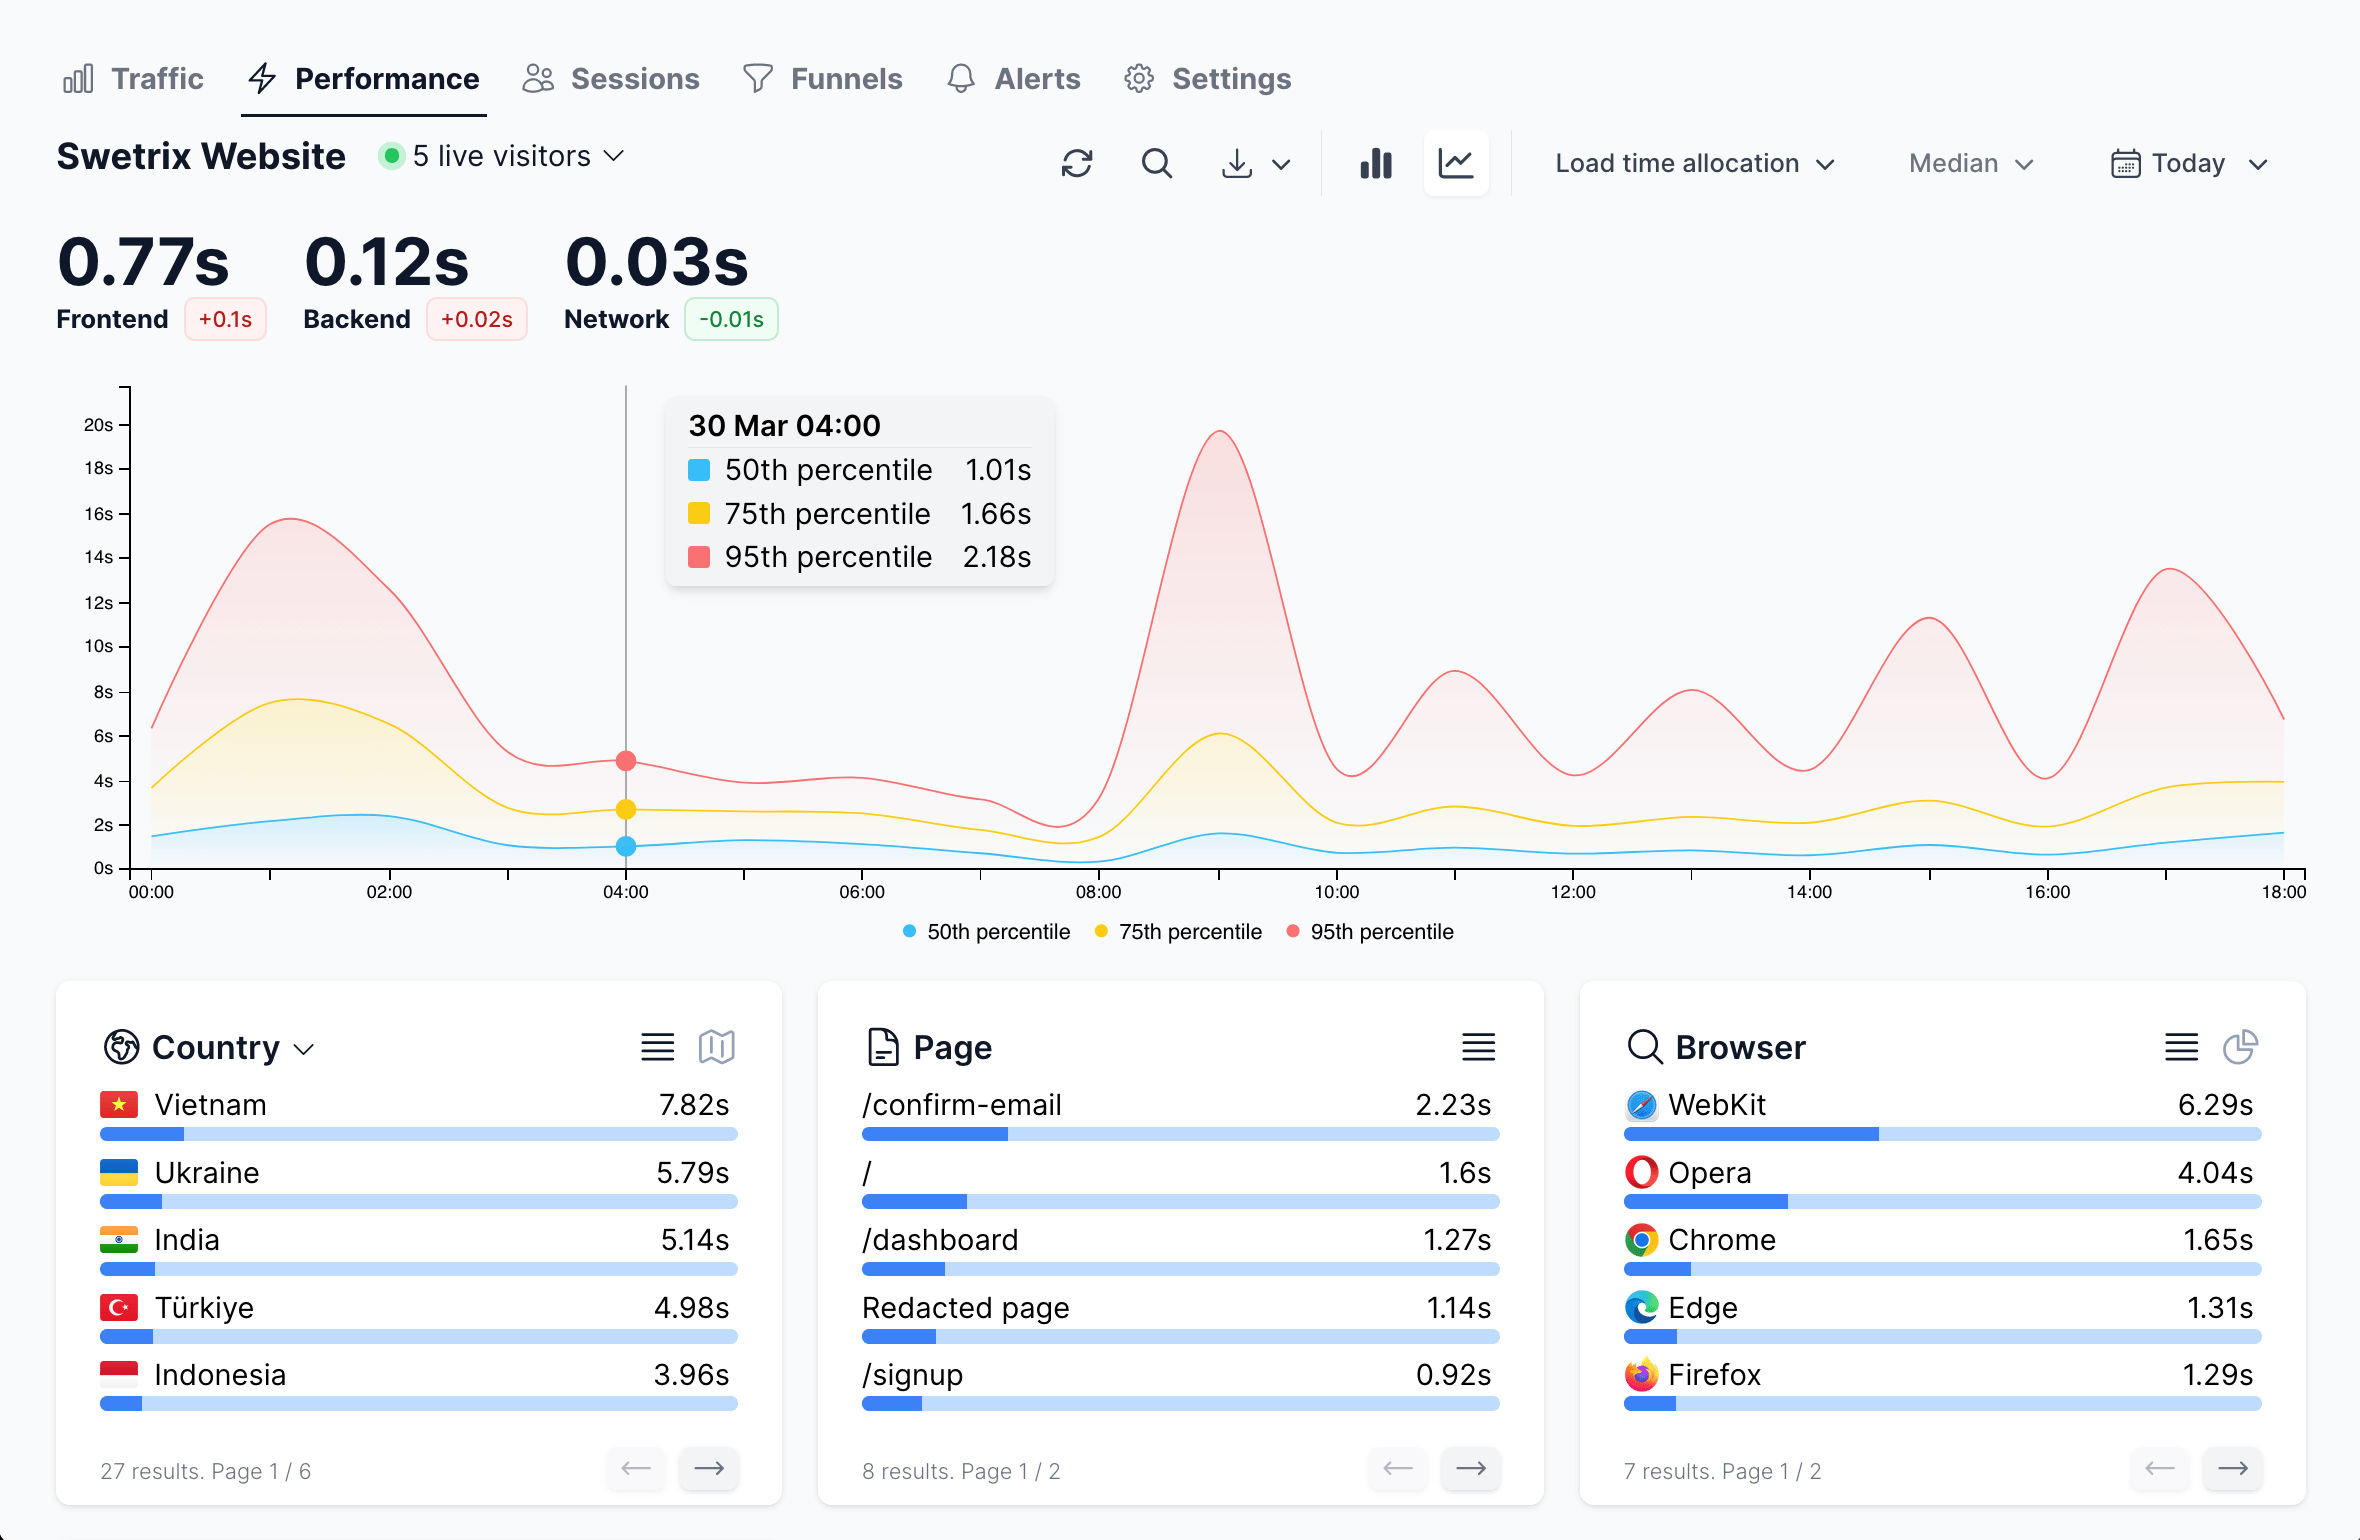
Swetrix combines cookieless marketing analytics with full-stack performance monitoring. Teams track Real User Monitoring (RUM) metrics without setting cookies. The platform captures page load speeds alongside UTM campaign data.
Marketing teams map traffic sources to load times while developers identify slow TTFB metrics across browsers. Swetrix tracks custom events, feature flags, and frontend errors. When a React component crashes, the platform captures the stack trace to reveal the UTM source that drove the user to the broken page.
Install Swetrix for live user tracking using the official script or package manager. Engineers integrate the tracker into the frontend application to configure custom alerts for slow page loads. These alerts map performance data to individual user flows.
WebPageTest & Lighthouse: Synthetic Lab Testing
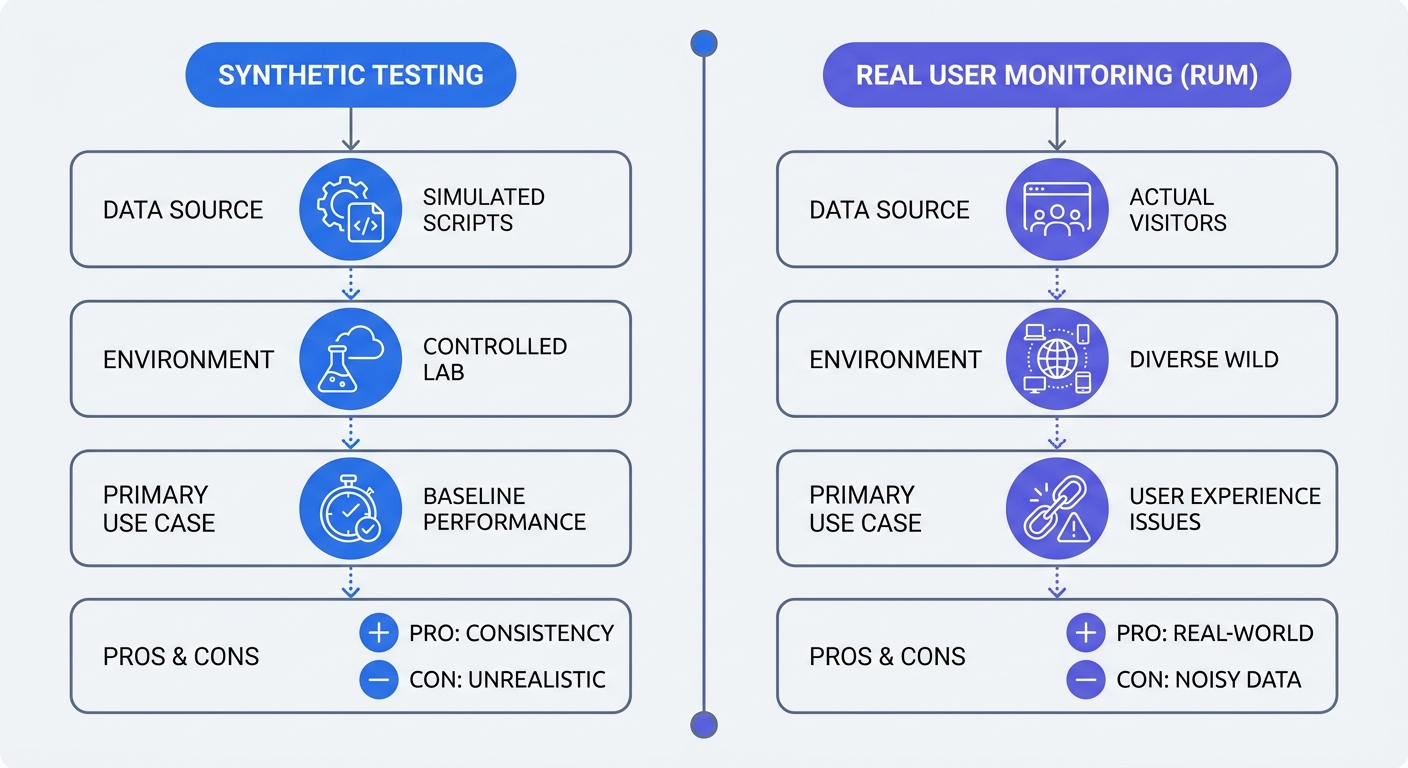
Synthetic testing simulates network conditions before code reaches production. Developers use these tools to catch massive regressions during the build process. Lighthouse runs in the Chrome browser console, allowing teams to run lab tests with 4G network throttling and CPU slowdown enabled. This identifies render-blocking resources and oversized image payloads. WebPageTest offers detailed waterfall charts to test multiple connections from various geographic locations.
Use synthetic tests during development and rely on RUM data for production monitoring. Open source synthetic tools lack real user context, and simulated lab data cannot replicate the unpredictability of an aging Android device on a weak cellular connection. Combine both methods for a complete testing cycle by running Lighthouse in the CI/CD pipeline while monitoring Swetrix in production.
SigNoz & OpenObserve: Deep APM Tracking
Backend infrastructure requires specialized monitoring. Application Performance Monitoring (APM) handles distributed tracing across microservices. SigNoz provides logs and metrics utilizing OpenTelemetry to track the milliseconds a database query takes to execute. This tracing identifies the API endpoint causing high frontend TTFB. OpenObserve offers a lightweight alternative for high-scale log ingestion.
Set up backend alerts for failed server responses. Operations teams use APM to find memory leaks in Node.js or Python environments. Connecting frontend analytics to backend tracing correlates spikes in frontend INP scores with bottlenecks in the database connection pool.
Implementing Performance Monitoring Best Practices
Blending Marketing Analytics with IT Metrics
Marketing campaigns fail when landing pages experience slow load times. Marketers must contextualize traffic source data by connecting UTM parameters with performance metrics. Add tracking tags to paid ads to monitor if campaigns experience higher bounce rates due to technical friction. A Facebook ad targeting mobile users fails if the landing page requires four seconds of JavaScript execution.
Analyze conversion variance across geographic regions. Retail stores in the U.S. and U.K. report higher baseline conversion rates due to mature broadband networks. Factor regional infrastructure maturity into performance baselines. Asian or Latin American markets require lighter asset payloads to achieve parity in page load speeds.
Build a shared reporting dashboard. Place the average session duration metric next to the LCP score. This setup highlights the correlation between speed and engagement for the target audience.
Mobile-First Optimization and Asset Deferment
Global e-commerce conversion rates reveal a massive device gap. Desktop traffic consistently achieves a significantly higher average conversion rate than mobile traffic, though these baselines vary by product type and industry. Fix mobile bottlenecks to capture lost revenue.
Mobile CPUs struggle to parse heavy JavaScript payloads. Deferring non-critical script execution improves INP scores. Add the defer attribute to third-party tracking tags and move resource-heavy chat widgets into a Web Worker using open source libraries like Partytown.
Prioritize mobile-first asset delivery by compressing large hero images using WebP or AVIF formats. Developers must define explicit width and height attributes on all media to prevent Cumulative Layout Shift (CLS). Use asynchronous loading for custom fonts to prevent invisible text during initial rendering.
Trim form fields to reduce input friction by dropping optional fields from the checkout flow. Combining mobile speed optimizations with simplified interfaces pushes mobile conversion rates closer to desktop averages.
Next Steps for the Analytics Stack
Deploying the Cookieless Infrastructure
Migrate from legacy platforms to modern open source alternatives. Teams start by mapping current tracking events to the new platform. Export historical data if the current vendor permits it.
Provision a dedicated server for self-hosting or choose a managed EU cloud option. Network administrators point a custom CNAME DNS record to the tracking endpoint and secure it with an SSL certificate. Update Content Security Policy (CSP) headers to allow the new first-party tracking domain.
Establish baseline performance alerts to track technical regressions. Configure notifications to trigger when the average LCP exceeds 2.5 seconds for more than an hour. This proactive alerting catches loading errors before thousands of users abandon the site.
Review performance metrics every week. Treat web analytics as an active debugging tool for daily performance checks. Align marketing and engineering teams around the shared goal of delivering fast, reliable user experiences.
Upgrade the current web analytics stack today. Swetrix offers an open-source, privacy-first analytics platform requiring no cookie banners. Track Real User Monitoring (RUM) metrics, identify JavaScript errors, and measure marketing campaigns in one unified dashboard.
Start a 14-day free trial of Swetrix Cloud today. Swetrix hosts cloud plans starting at $19/mo for 100,000 events on EU servers. Take control of the data pipeline and improve website speeds.