- Date
Best Free Website Analytics Tools for Every Site
 Andrii Romasiun
Default server logs provide raw hit counts, but automated bot activity, search engine crawlers, and asset pre-fetching can distort them. On the other end of the spectrum, massive enterprise trackers slow down page loads, inflate script weight, and leave you navigating complex data-retention policies for visitor data. Google Analytics 4, for example, lists data retention as up to 14 months per property, and Google says properties can upgrade to Analytics 360 for higher limits. Finding a permanent replacement means comparing platforms that define their unpaid tiers in different ways.
Selecting the best free website analytics tools means matching your technical capacity to a pricing and hosting model. A permanent zero-cost plan operates differently than an open-source software license. Neither functions like a timed trial. Hosted free plans run on the provider's infrastructure, though they frequently cap hits, pageviews, or custom events. Self-hosted software removes the monthly platform fee entirely. In return, your organization absorbs the infrastructure costs for server hosting, secure storage, and database maintenance.

Trials exist in a separate category, as they eventually expire and require a transition. Plausible currently offers a trial lasting 30 days without a credit card, while Matomo offers a 21-day trial for its cloud environment. Swetrix provides a 14-day cloud trial that requires a payment method to begin. Because trial terms differ in scope, the right choice depends on the questions you want answered about your audience. A simple personal blog tracking weekly readership does not require the same instrumentation as a SaaS onboarding funnel or an agency managing analytics for dozens of client accounts.
Comparing Free Website Analytics Tools by Use Case
No single dashboard serves every web property. A high-volume programmatic SEO site prioritizes raw pageview efficiency, while a software-as-a-service application requires detailed conversion funnels, custom event properties, and diagnostic reporting.
To compare your options, look at their primary function, revenue model, and operational trade-offs.
| Analytics Tool | Best Fit Use Case | Free Model Type | Main Operational Trade-Off |
|---|---|---|---|
| Swetrix Community Edition | Privacy-first product analytics | Self-hosted software | Requires server infrastructure and maintenance |
| GoatCounter | Simple blog traffic stats | Hosted service | Temporary identification limits cross-session tracking |
| Cloudflare Web Analytics | Lightweight performance data | Hosted service | Focuses on basic metrics over custom event depth |
| Umami Cloud Hobby | Personal and low-traffic sites | Hosted plan | Usage caps include both hits and custom event data |
| Microsoft Clarity | Behavioral diagnostics | Hosted service | Uses anonymous visitor data for machine learning models |
| Matomo On-Premise | Broad self-hosted tracking | Self-hosted software | Advanced reporting features require paid plugins |
If you run a blog, GoatCounter, Cloudflare, or Umami can offer immediate visibility into daily traffic. For page-level friction analysis, pair a primary traffic reporter with Microsoft Clarity. If you can manage deployments, consider Swetrix or Matomo to retain total ownership over event data. For client-facing portals, tenant separation, branding controls, and API limits are key factors in choosing a platform.
Swetrix Community Edition: Best for Privacy-First Analytics That Can Grow
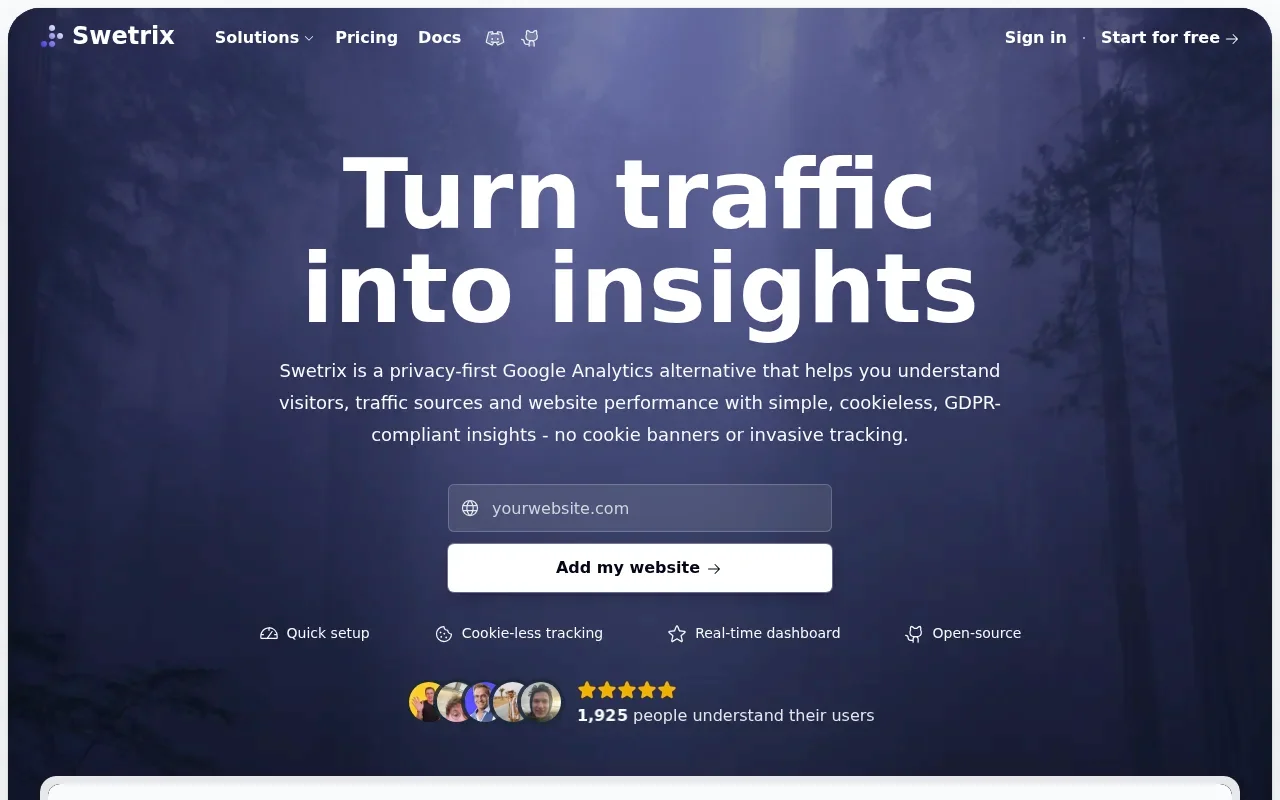
Swetrix bridges the gap when you start with basic traffic and referral data but rapidly scale into needing product insights. Deploying a cookieless Google Analytics alternative still allows you to build conversion funnels, track custom events, and monitor technical performance.
The Swetrix Community Edition is fully open-source under the AGPLv3 license. You can download and modify the core application without paying a software fee, though you must budget for the server instances, database storage, and operator time required to keep the system secure and running smoothly. Managing the deployment means running your own application instances, maintaining the database layers, setting up automated backups, and applying software updates when new releases publish to the repository.

Once deployed, the tracking script monitors user sessions without writing persistent cookies to the browser. This privacy-first approach helps reduce reliance on intrusive consent banners, as it is cookieless and built to respect visitor privacy standards. The dashboard displays standard metrics like unique visitors, popular pages, and bounce rates, and extends into active product analytics. You can define custom events for specific user actions, build conversion funnels to track checkout abandonment, and monitor client-side API errors directly alongside your traffic reports.
Tracking custom events allows you to measure meaningful interactions, such as newsletter sign-ups, file downloads, or button clicks, by attaching descriptive metadata to each event payload. You can organize these events into multi-step funnels to see where visitors drop off during a multi-page checkout or onboarding flow. Because Swetrix also logs client-side JavaScript errors and captures performance metrics, technical teams can pinpoint whether a sudden conversion drop is caused by broken code or slow load times on specific browser versions.
Depending on your configuration, Swetrix also supports session replays by routing the recorded user interactions to a private S3-compatible storage bucket. Because recordings may capture page state, mouse movements, and non-password input, configure strict masking rules and ask visitors for explicit consent before recording sessions, especially on public pages that might display personal data. The Community Edition also includes A/B testing infrastructure, though small websites should treat the platform's sample-size estimates as planning aids rather than guarantees of statistical significance. Low-traffic sites often lack the statistical power required to produce decisive test results within a reasonable timeframe.
If you are transitioning away from legacy tools, Swetrix documents historical data imports from GA4, allowing you to bring past performance metrics into your new dashboard. Review the import coverage before migrating, because differences in data models and custom dimensions mean not every GA4 event maps one-to-one into alternative systems.
Adding SEO Context with Google Search Console
Swetrix integrates directly with Google Search Console to bring acquisition context into your behavioral data. You connect a verified Search Console property via the API, importing search performance metrics into a dedicated view.
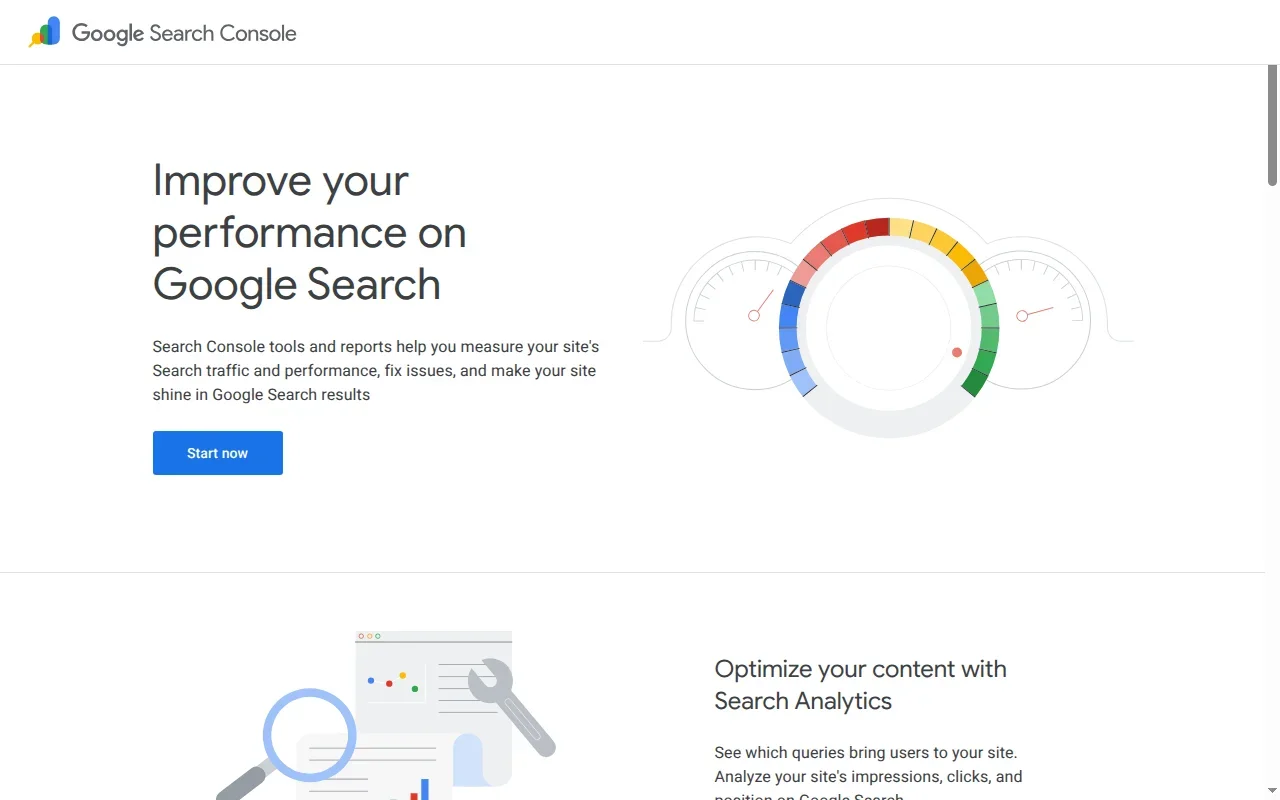
This integration displays clicks, impressions, average click-through rate, average search position, query strings, and top landing pages. Search Console supplies the raw search-performance data, while your self-hosted analytics add context about what those visitors do immediately after arriving. Combining these metrics makes it easier to analyze a specific referral source or track a campaign's post-click behavior. You can see which search queries brought visitors to a blog post, then check whether they explored other documentation pages or left immediately.
For agencies and B2B products, Swetrix supports dashboard sharing and iframe embedding for client portals. Its current access model, tenant separation, and API limits are worth assessing before using it as a turnkey white-label solution. Embedding a dashboard inside an agency portal provides clients with live traffic reports without exposing administrative configurations, but requires enough server capacity to handle the extra concurrent dashboard requests.
GoatCounter: Simple Blog Traffic Stats
If you want an uncomplicated, fast-loading dashboard, GoatCounter offers a strong option. The platform strips away the dense menus of an enterprise marketing suite, focusing entirely on referrers, traffic paths, and basic device metrics.
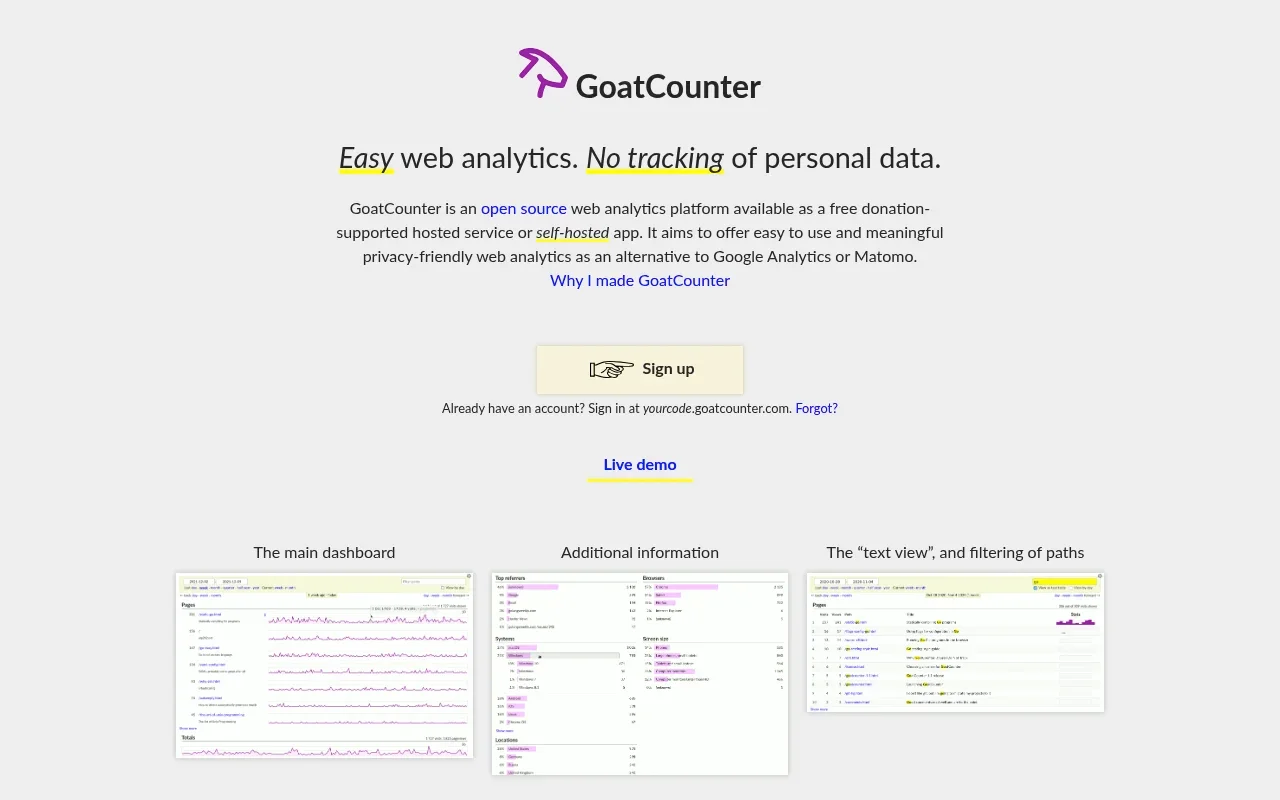
The hosted service is available at no cost for reasonable public use, which covers most personal sites and small-to-medium businesses. It provides a clean interface that highlights which domains are sending traffic and which specific pages hold visitor attention. The dashboard loads almost instantly because it avoids heavy visualization libraries and renders data in simple, condensed tables.
GoatCounter counts unique visits differently than persistent-cookie trackers. When a user arrives, the server relies on temporary in-memory IP and User-Agent matching to create a visit identifier. Because the application uses a rotating salt to generate a hash, those raw source values are never stored to disk or written to the database. This creates a highly private tracking environment. Consequently, visitor counts will naturally drift when compared to platforms that track long-term persistent sessions. Compare trends consistently within GoatCounter rather than expecting its absolute totals to match a cookie-based tool.
The platform handles campaign tracking through URL parameters such as ref or standard UTM tags, grouping incoming links by campaign name directly on the main screen. This setup suits independent writers, technical documentation hubs, and portfolio sites that need clear referral tracking without the overhead of tag managers or event schema design.
Cloudflare Web Analytics: Best for Lightweight Traffic and Performance
Cloudflare provides a lightweight analytics tool built to monitor basic traffic volume alongside real-user experience metrics. It operates as a distinct service from Cloudflare's network-level proxy analytics, relying instead on a small JavaScript beacon embedded in your site's HTML.
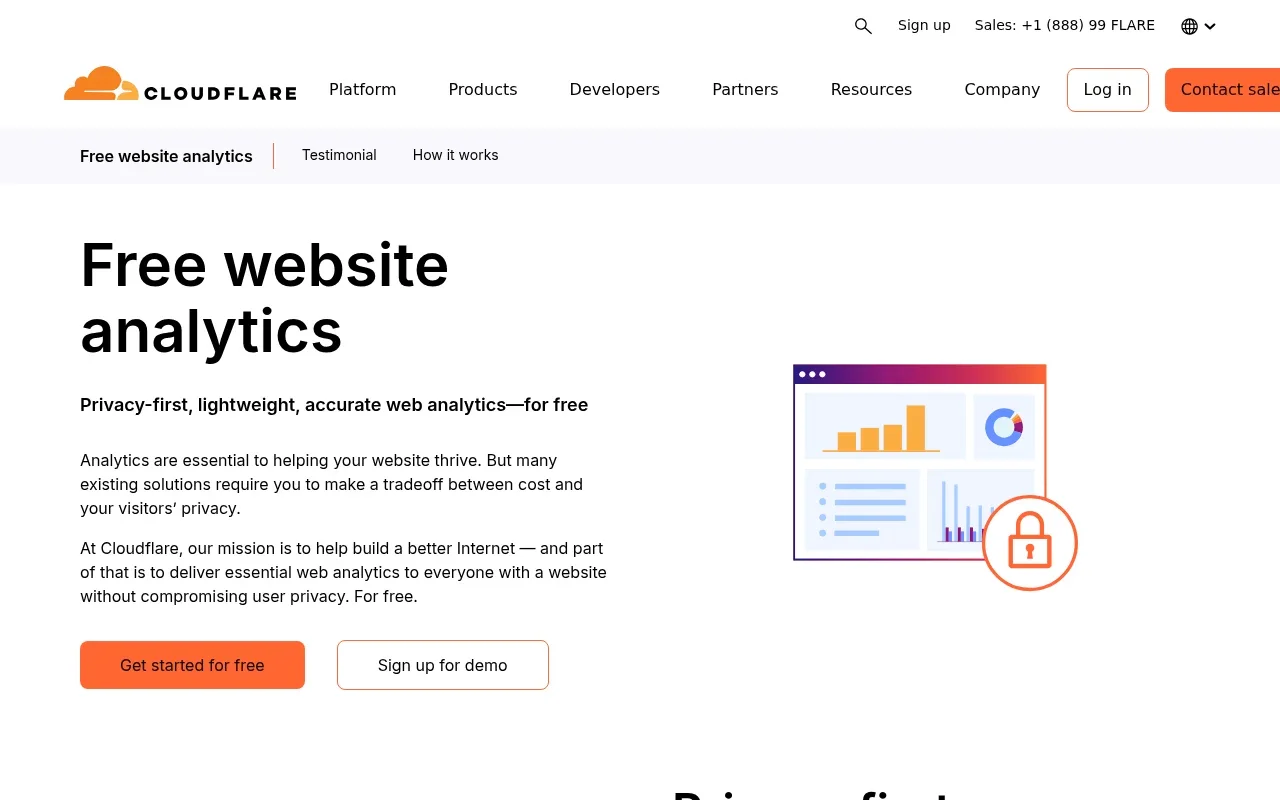
This script deployment means you do not have to change your DNS settings or route your traffic through Cloudflare's proxy servers to use the dashboard. The beacon logs pageviews and visitor counts while capturing Core Web Vitals like Largest Contentful Paint and First Input Delay. The tool serves as an effective companion for validating issues identified by an on page SEO checker, allowing you to see exactly how fast your site loads for users on cellular connections versus broadband.
The interface breaks down real-user performance across desktop, mobile, and tablet devices, displaying visual distributions of page load speeds and responsiveness metrics. You can filter these metrics by country, host, and path to detect regional latency issues or slow-loading templates across your domain.
Cloudflare describes its Web Analytics as privacy-first and lightweight, and says it provides essential statistics on website usage. Functional depth is the trade-off for this lightweight footprint. It covers straightforward traffic and performance monitoring, but it does not support custom-event funnels, detailed user journey mapping, or session replays. If your measurement strategy relies on tracking button clicks, user account states, or lead-generation forms, you will need a more specialized analytics engine.
Umami Cloud Hobby: Best for Personal and Low-Traffic Sites
Umami presents a streamlined interface designed around speed and visual simplicity. If you want to avoid self-hosting, the Umami Cloud Hobby plan offers a hosted starting point aimed at personal projects and low-traffic web properties.

The dashboard provides immediate visibility into pageviews, bounce rates, and geographic distribution without navigating complex report builders. You install a small tracking script, and the interface populates in real time. The layout uses a single-page overview that presents visitor statistics, top referrers, device types, browser choices, and operating systems at a glance.
On Umami Cloud's free Hobby plan, usage is measured by website hits and custom events or stored custom-event data, according to the Cloud FAQ documentation. Each website hit counts as one event, and each saved event-data property counts as one event, so recording custom events or storing more event properties increases the usage total.
The documentation also specifies that Cloud servers are located in the US and EU, which factors into your data residency compliance planning. You can generate public sharing links to showcase dashboard statistics to clients or external collaborators without creating dedicated user accounts. Check the current usage limits on their plan page before attaching a rapidly growing site to the Hobby tier.
Microsoft Clarity: Best for Heatmaps and Behavioral Diagnostics
Clarity functions as a behavioral-analysis companion rather than a standalone traffic-reporting platform. You can install it alongside tools like Swetrix or GoatCounter to investigate visitor friction that raw numbers cannot explain.

The platform visualizes aggregate user behavior through scroll heatmaps and click tracking. You can identify exactly where visitors abandon a long-form article or which navigation elements attract "rage clicks", which are rapid, repeated clicking that signals broken functionality or confusing design. Clarity also flags dead clicks, which occur when a user clicks on an unlinked element expecting a response, and excessive scrolling, which highlights pages where users struggle to find relevant information.

Microsoft describes Clarity as a free user behavior analytics tool with session replays and heatmaps on its pricing page. Since Clarity is free, its data-use terms are a key part of deciding whether it fits your organization. Microsoft uses the anonymous behavioral data gathered through the script to improve its machine-learning models. They state they do not share this data with third parties. Weigh this external data processing against your internal policies and regional disclosure requirements before adding the script to a production environment.
The platform integrates smoothly with traffic tools, providing video-like session recordings that reveal layout shifts, form abandonment points, and mobile responsiveness bugs. You should configure masking on input fields and sensitive content areas to prevent personal data from being recorded during user sessions.
Matomo On-Premise: Best for Broad Self-Hosted Analytics
If you require a massive, deeply customizable self-hosted platform, you might deploy Matomo On-Premise. The software provides an interface and reporting structure that feels familiar if you are migrating away from legacy analytics dashboards, presenting dense tables of acquisition, behavior, and conversion data.
The core software is free to download, offering unlimited users and data collection without artificial caps. Deploying it requires a server running PHP and MySQL, and high-traffic sites need significant database tuning to process daily log archives efficiently. You manage the security patches, the version upgrades, and the storage scaling entirely in-house.
Running Matomo on high-traffic sites requires setting up automated cron jobs for command-line archiving, because processing reports directly in the browser can overload the web server. You also need to manage database disk growth, as detailed visitor logs accumulate substantial storage volume over time.
Matomo restricts several advanced capabilities to its paid marketplace. While standard event tracking and goal conversions ship with the core application, features like conversion funnels, heatmaps, and session recording require purchasing annual plugin licenses. Treat the On-Premise edition as a powerful foundational layer that requires active maintenance, keeping it conceptually distinct from their separately billed managed Cloud service.
Stop wrestling with complex tracking setups that compromise visitor privacy. Try Swetrix to get powerful, cookieless analytics, custom event funnels, and technical SEO monitoring in one clean dashboard.