- Date
Mastering Analytics for SaaS: A Privacy-First Growth Guide
 Andrii Romasiun
A visitor clicks a paid search ad, browses your pricing page, and leaves. Two days later, they return via a bookmark. They sign up for a paid tier. Default analytics platforms attribute the conversion to direct traffic. The attribution model ignores the initial paid click. The marketing team cuts funding for a profitable ad campaign due to this missing data.
Accurate data collection prevents this revenue leak. Tracking users in 2026 requires balancing granular marketing insights with global privacy laws. A privacy-first analytics stack improves conversion rates, lowers customer acquisition costs, and guarantees data compliance.
The New Era of Analytics for SaaS
The Privacy Paradox in Software
Software buyers inspect third-party data tracking before signing any enterprise contract. Across the globe, 79.3% of the population operates under active data privacy legislation. To manage these new compliance requirements, large organizations allocate more than $2.5 million each year toward privacy operations.
SaaS founders face a distinct analytics paradox. Building a growth model requires granular funnel metrics. Platform users expect complete data privacy. When companies violate tracking laws, regulators enforce heavy fines.
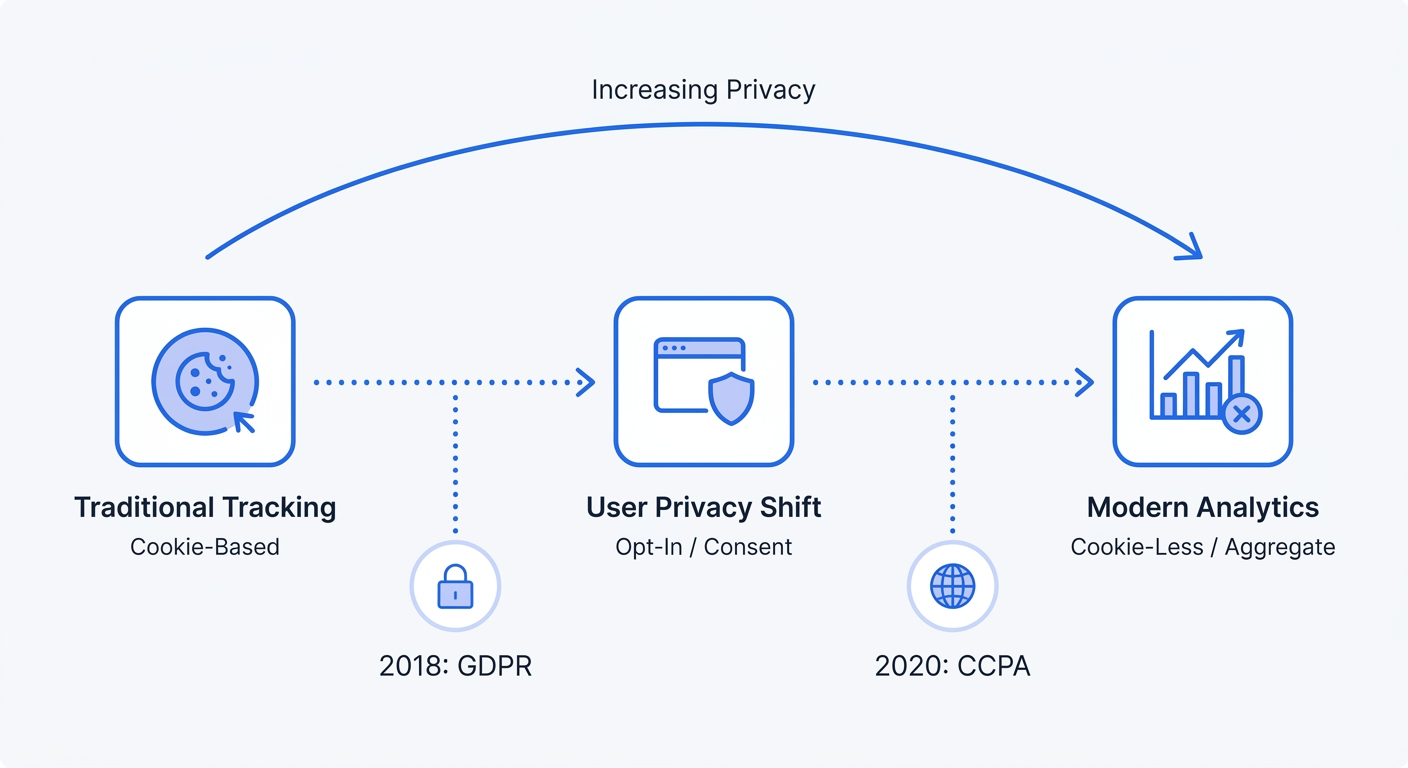
Traditional tracking platforms log identifiable information like IP addresses and device fingerprints. This approach forces engineering teams to build complex consent management platforms. Facing intrusive popups, visitors reject these banners. Marketing teams see massive gaps in top-of-funnel traffic reports.
Start by auditing your current marketing analytics tools. Open the developer console on your website. Third-party cookies must not fire before a visitor clicks "accept." If your current setup drops trackers without explicit consent, switch to an aggregate, cookie-free platform.
Meeting Global Compliance Requirements
Compliance involves more than basic cookie warnings. Through data localization laws, foreign governments require companies to store analytics information within specific geographic regions. To satisfy GDPR rules, SaaS providers must process European Union visitor session data on European servers.
Select an analytics vendor defaulting to EU data hosting. Route all tracking requests through a proxy server to strip IP addresses before they reach your primary database. Implementing this setup creates a buffer between the visitor's browser and your analytics reports.
Review your data retention policies. Configure your analytics tools to delete raw server logs after 30 days. Keeping anonymized, aggregate reporting data maintains long-term trend analysis capabilities without violating retention mandates.
Core SaaS Financial Metrics to Track
Mastering CAC and LTV Ratios
Financial leaders use Customer Lifetime Value (LTV) and Customer Acquisition Cost (CAC) to measure the health of a subscription product. For standard B2B software, a baseline healthy LTV:CAC ratio sits at 3:1. Over an 8-year lifespan, top-performing vertical SaaS companies achieve implied ratios of 23.5x.
Acquisition costs climb across all categories every quarter. Payback periods measure the speed a business earns back the cost of acquiring a customer. Target audience size influences this threshold. SMB proptech platforms break even in five months, while enterprise retail software requires 24 to 31 months to recover the initial sales investment.
Calculate your CAC. Divide total sales and marketing spend by the number of new customers your team acquires in a given period. The numerator must include salaries, ad spend, software subscriptions, and event costs.
After finding the aggregate number, segment this calculation by acquisition channel. Paid search might carry a 12-month payback period, while organic content breaks even in three. Reallocate your marketing budget toward the channels proving the shortest payback cycles.
The Power of Expansion ARR
Acquiring new logos requires increasing amounts of capital every year. For mature software platforms, Expansion Annual Recurring Revenue (ARR) drives sustainable growth. Across the average SaaS business, upsells and seat expansions represent 40% of new ARR.
As companies cross $50 million in total ARR, they generate over 50% of their new revenue from existing customers. High-performing sectors like FinTech achieve 96% gross retention rates. Direct your product and marketing teams to prioritize retaining and expanding current accounts.
Segment your active user base into pricing tiers within your CRM. Search for customers approaching their plan limits. Product marketers should send an automated email sequence highlighting the features available in the next tier. Inside your analytics dashboard, track the open rates and upgrade conversions of these expansion campaigns.
Top-of-Funnel Web Analytics Benchmarks
Evaluating Content Engagement
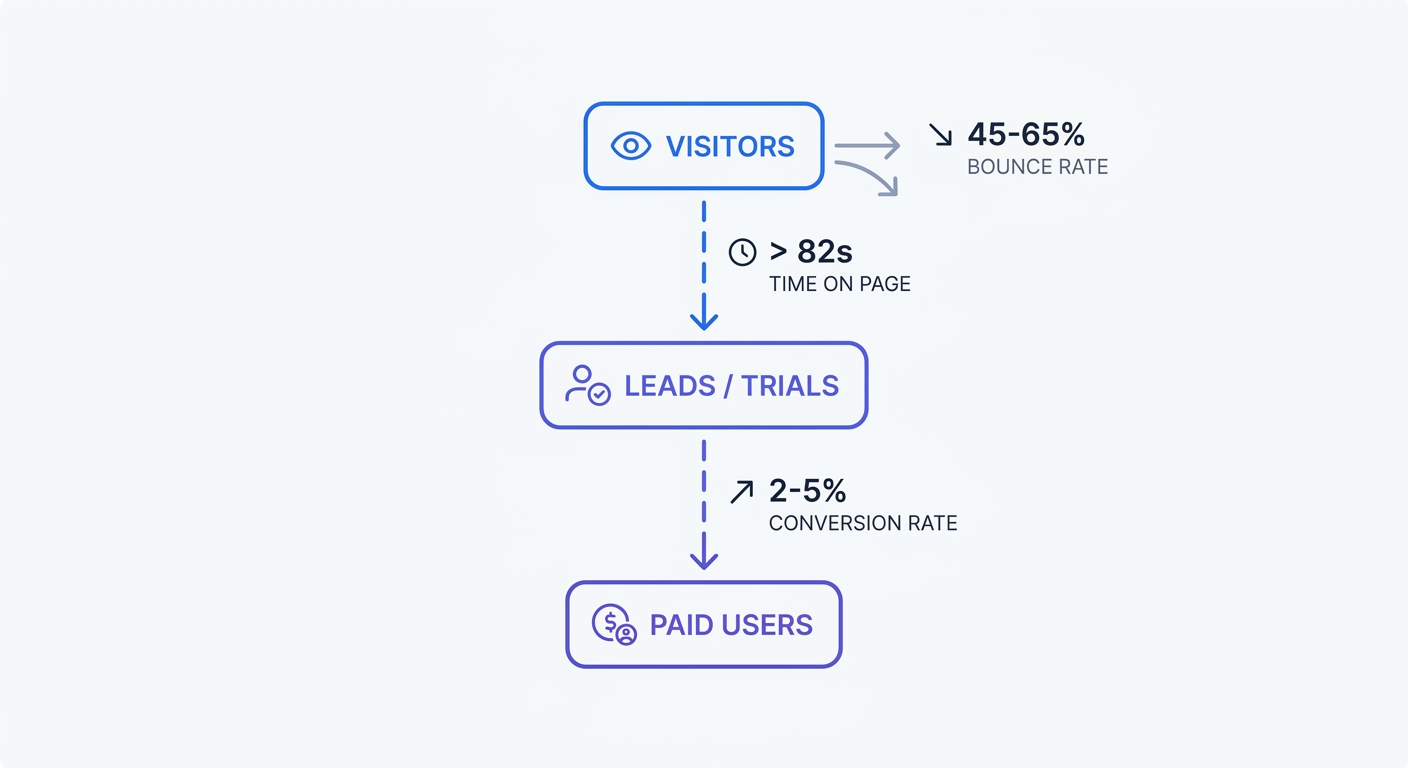
Marketing teams produce blog posts, whitepapers, and case studies to attract prospective buyers. Teams require specific engagement benchmarks to measure the success of these assets. Top-of-funnel content demands an average time on page above 82 seconds for B2B software—though the global average across all industries sits around 54 seconds. Long-form technical guides require four to six minutes of reading time.
Standard bounce rates for B2B software websites fall between 45% and 65%. When a bounce rate exceeds 70%, the ad copy mismatches the landing page experience. Visitors leave when the page fails to answer their initial search query.
Build an engagement tracking protocol on your primary domain. Define a custom event firing when a reader scrolls past 50% of your article. Evaluating this scroll depth metric alongside time on page identifies your highest-performing written content. Content marketers update underperforming articles with stronger headlines, bulleted lists, and compressed images.
| Content Type | Target Time on Page | Acceptable Bounce Rate | Target Conversion Rate |
|---|---|---|---|
| Blog Post (Top-of-Funnel) | > 82 seconds | 55% - 65% | 0.5% - 1% |
| Long-Form Guide | 4 - 6 minutes | 45% - 55% | 1% - 3% |
| Feature Landing Page | > 60 seconds | 40% - 50% | 2% - 5% |
| Demo Request Page | > 45 seconds | 30% - 40% | 5% - 10% |
Optimizing Landing Page Conversions
Traffic holds zero value without down-funnel conversions. For primary SaaS actions like demo requests or free trial signups, a healthy conversion rate hovers between 2% and 5%. By adding product walkthrough videos or interactive calculators, teams help optimized landing pages reach 10% conversion rates.
Test your call-to-action (CTA) placement across the page. A secondary CTA halfway down the content block captures users ready to convert before reading the full feature list.
Launch an A/B test on your highest-traffic pricing page. The engineering team builds two variations: one with monthly pricing as the default toggle, and one with annual pricing. Track which variation produces higher immediate MRR and better long-term retention. Data analysts use an A/B test calculator to verify the statistical significance of your results before the web team pushes the winning design to production.
Building a Privacy-First Analytics Stack
Web Analytics vs. Product Analytics
Modern software companies split their data collection into two distinct environments. Web analytics handles the pre-login journey. Following account creation, product analytics tracks post-login behavior.
Privacy-first web analytics platforms monitor marketing channels, page views, and trial conversions. These tools process anonymized traffic patterns. During this phase, zero personal data enters the system.
Product analytics platforms monitor user actions inside the application. Engineers configure distinct user IDs to track feature adoption, time-to-value, and churn risk. Since the user creates an account and accepts your terms of service, post-login tracking permits behavioral monitoring.
Keep these two systems separate. Funnel marketing site traffic through a cookieless analytics provider. Heavy event tracking and user identification belong in the authenticated application environment. This architecture protects visitor privacy while delivering actionable product usage data.
Frictionless Funnels Without Cookies
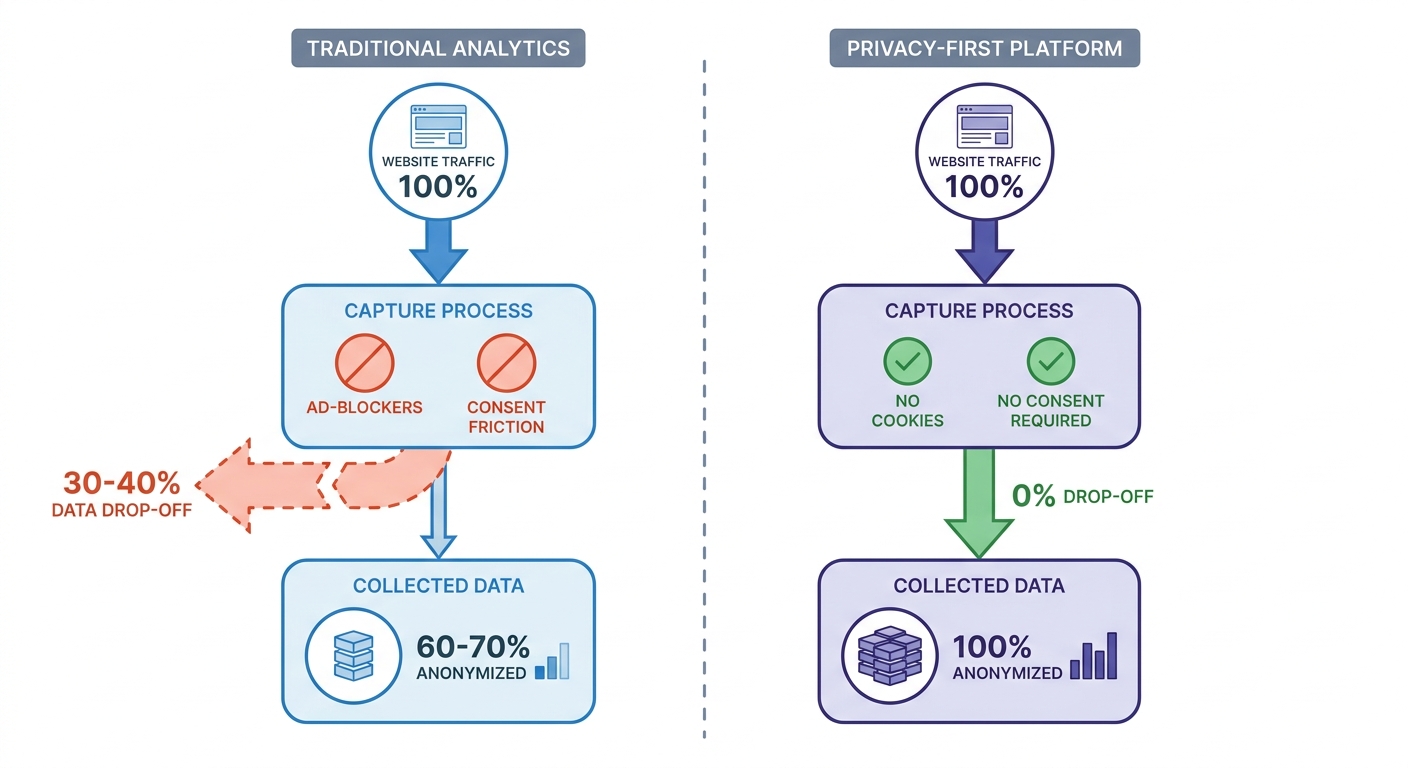
Traditional tracking scripts rely on third-party cookies. Privacy-focused browsers like Safari intercept these scripts alongside standard ad-blockers. Marketing teams lose 30% to 40% of their data to these blocklists. Losing this volume of traffic inflates reported customer acquisition costs.
Cookie banners compound the tracking problem. When visitors decline tracking, their sessions disappear from your reports. This gap breaks the user journey and prevents accurate attribution.
Remove invasive cookie-based trackers from your marketing site. Implement a server-side or aggregate analytics platform. Swetrix provides a Google Analytics alternative hashing user data and deleting it every 24 hours. Employing this method removes the need for consent banners.
Dropping the cookie banner improves the user experience. Developers measure faster page load speeds and shorter conversion paths. Marketing teams reclaim visibility into aggregate website traffic without violating visitor trust.
Fortifying Data Collection Mechanisms
Server-Side vs. Client-Side Tracking
Client-side analytics loads a JavaScript file in the visitor's browser. The browser sends tracking events to the analytics server. Most SaaS websites use this default setup. It installs in minutes but suffers from heavy data loss when ad-blockers intercept the browser requests.
Server-side tracking moves the data collection process to your own infrastructure. The visitor's browser communicates with your web server. Your web server forwards the tracking data to the analytics platform via an API.
Ad-blockers ignore requests originating from a verified domain instead of a third-party script. Marketing teams capture exact visit counts and conversion events.
Configure a reverse proxy to handle analytics requests. Infrastructure tools like Caddy, Nginx, or an edge network like Cloudflare route a specific path to your tracking provider. Implementing server-side tracking shields your data from client-side interference while maintaining control over the information leaving your infrastructure.
Monitoring Application Performance
SaaS platforms live and die by application speed. Slow load times kill conversion rates and increase user churn. Web analytics must track more than pageviews; developers must measure the underlying health of the software.
Track core web vitals across all public-facing pages. Largest Contentful Paint (LCP) measures how long the main page content takes to render. A healthy SaaS marketing site hits an LCP under 2.5 seconds. First Input Delay (FID) tracks the time from a user's first interaction to the browser's response. Keep FID under 100 milliseconds.
Developers use an integrated performance monitoring dashboard to isolate slow assets. Unoptimized background videos or oversized image files drag down load speeds. Compress these assets and deploy them via a Content Delivery Network (CDN). Webmasters verify the improvement in performance reports the next day.
Auditing Data Security and Error Tracking
Identifying Frontend Application Errors
Beyond revenue and traffic, analytics platforms monitor the structural integrity of a web application. A user clicking a broken signup button results in a lost customer. Standard traffic reports miss this failed interaction.
Implement dedicated error tracking to catch frontend JavaScript failures. Upon script failure, the tracking platform records the error message, the visitor's browser type, and the page URL.
Engineering managers should open error logs every Monday morning. Sort the recorded issues by frequency. Assign the top three recurring errors to the current sprint. Fixing a silent checkout bug produces a higher return on investment than launching a new ad campaign.
Blocking Malicious Bot Traffic
Automated scrapers distort baseline analytics data. Throughout the week, these automated scripts visit pricing pages, submit fake trial requests, and scrape site content. If bots account for 20% of total traffic, conversion rate formulas break.
Protect your signup forms with a privacy-focused reCAPTCHA alternative. These lightweight tools stop automated submissions without forcing human visitors to click grids of traffic lights.
Filter known bot IP ranges from your web server logs. Site administrators must configure the analytics platform to ignore traffic originating from major data centers like AWS or DigitalOcean. Human visitors do not browse the web from an enterprise server farm. This filtration produces a clean dataset of human interactions.
Best Practices for Actionable Insights
Unifying Funnel Data Without PII
Linking top-of-funnel marketing campaigns to bottom-of-funnel revenue requires strategic configuration. Teams must connect the initial ad click to the final subscription payment without passing identifying information to the web analytics platform.
Pass clean, anonymized UTM parameters from your tracking setup into your payment processor. Tools like Stripe or Paddle accept custom metadata fields during checkout.
Follow these configuration steps:
- Generate standard tracking links for all marketing campaigns using a UTM code builder. Input the source, medium, and campaign name to build a consistent URL string.
- Write a custom script on your landing page to read the
utm_sourceandutm_campaignparameters from the URL. The script captures these values upon page load. - Store these extracted values in the browser's local storage or a first-party session variable. This storage keeps the attribution data intact as the user browses different pages.
- Append these stored values as hidden fields when the user submits a demo request or trial signup form. The form payload carries the attribution data alongside the user's email address.
- Push the UTM data into your CRM record upon form submission. Map the hidden fields to custom attribution columns in your customer database.
Sales representatives read the CRM record to identify which marketing campaign sourced the lead. Marketing executives evaluate the final contract value against the initial ad spend. Through this configuration, the web analytics platform remains free of personal data while the business achieves full-funnel attribution.
Executing Cohort Analysis
Aggregate traffic graphs display high-level directional trends. To uncover actionable retention data, growth teams use cohort analysis. A cohort groups users by a shared characteristic, such as the month they signed up or the marketing channel that acquired them.
Reviewing basic MRR growth masks churn problems. A business adding $10,000 in new MRR while losing $8,000 in existing MRR appears healthy on a high-level graph. Growth teams expose underlying churn by tracking distinct user groups over time.
Build a retention table in your analytics dashboard. Group users by their acquisition month on the Y-axis. Tracking their retention rate across subsequent months on the X-axis reveals performance trends.
Isolate drop-off points in the matrix. If the January cohort shows a 40% churn rate in month three, investigate the product experience at that milestone. Check the product roadmap to see if the onboarding sequence ends there. Product managers must verify if a prominent paywall restricts access.
Marketers segment cohorts by acquisition channel. Compare the 12-month retention rate of users the marketing team acquires via LinkedIn ads against users finding the product through organic search. This comparison identifies which channels attract long-term subscribers and which channels generate churn. Defund the marketing campaigns failing to surpass your vertical's CAC payback period.
SaaS growth relies on accurate data. Invasive tracking scripts inflate acquisition costs and alienate prospective buyers. Aggregate, cookieless analytics deliver the conversion data teams need while protecting user privacy. Start your free trial of Swetrix to capture marketing data and build a privacy-first tech stack.