- Date
What Is Scroll Depth Tracking? A Guide For Marketers
 Andrii Romasiun
A visitor clicks a search result on their phone, spends five seconds on your article to view the hero image, and closes the tab. You log a pageview as a success in your dashboard, even though the user consumed zero content.
To understand user behavior, you must learn what is scroll depth tracking. You measure the vertical distance a user scrolls down a page using this behavioral metric. Analytics servers log load events, whereas scroll depth reveals content consumption. The average scroll depth dropped to 55 percent of a page by 2026. Visitors scan headers and abandon pages in seconds. Track these stop points to identify and fix specific drop-off zones.
Understanding What Is Scroll Depth Tracking
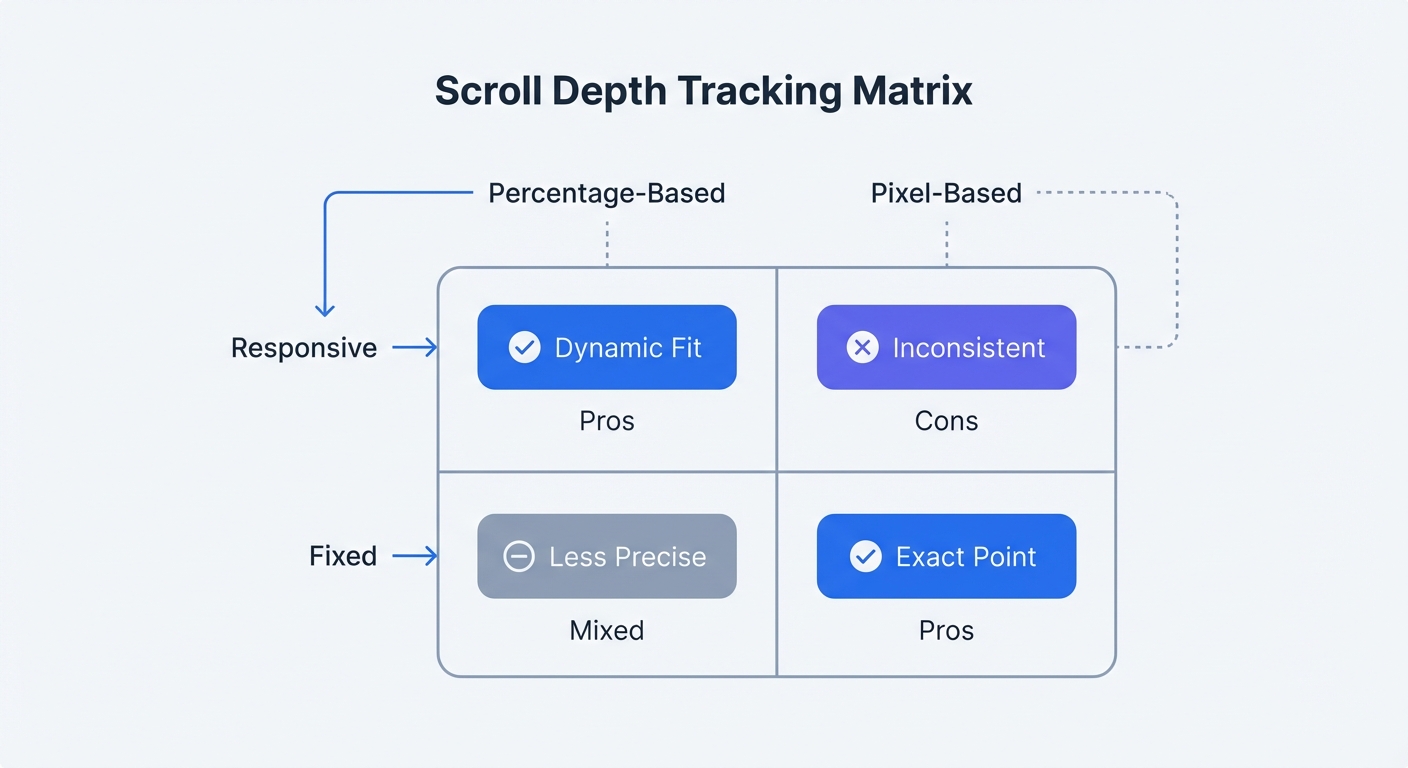
Percentages vs. Pixels
Marketers record milestones at 25, 50, 75, and 100 percent of the total page height using a percentage-based setup. Configure this method for responsive websites. A scroll to the midpoint on a mobile screen triggers the same milestone as a midpoint scroll on a wide monitor.
You log specific depths, such as 500 pixels, using pixel-based tracking. Choose this approach for fixed-height web applications. If a checkout button sits at 800 pixels from the top of the viewport, configure a tracker for that precise coordinate to confirm visibility.
| Tracking Method | Best Use Case | Pros | Cons |
|---|---|---|---|
| Percentage-Based | Responsive design, blogs | Adapts to any screen size | Ignores specific element locations |
| Pixel-Based | Fixed layouts, web apps | Pinpoints specific element visibility | Breaks on mobile screen resizes |
The browser software calculates the user's vertical position, adds the height of the visible window, and divides that sum by the total document height. You view these mathematical results inside your analytics reports.
Why Pageviews Are A Vanity Metric
Tracking scripts execute on load to register pageviews. A user might open five tabs in the background and ignore four of them. You will see five distinct pageviews in a standard report despite the lack of active reading.
Filter out this passive noise by combining load events with scroll milestones to calculate active engagement rates. If 10,000 visitors load a page but fewer than 400 reach the 25 percent mark, your headline failed to capture attention. Rewrite the opening paragraph to hook readers before they bounce.
Marketers uncover user intent by analyzing behavioral metrics. A high bounce rate combined with a 10 percent average scroll depth indicates a mismatch between the search query and the page content. Users who read 80 percent of the page before leaving consumed the material but found no path forward. Add relevant internal links at the bottom of the content to retain these engaged visitors.
The Rise Of Non-Linear Scrolling
Modern readers refuse to consume content from top to bottom. Website visitors scan subheadings, jump through documents via anchor links, and hunt for specific answers while ignoring surrounding text.
Map this scattered behavior using vertical milestones. You might spot a cluster of activity at the 75 percent mark while the 50 percent threshold remains untouched. Delete the skipped filler content and move the popular section closer to the introduction.
What Is A Good Average Scroll Depth?
Benchmarks By Content Type
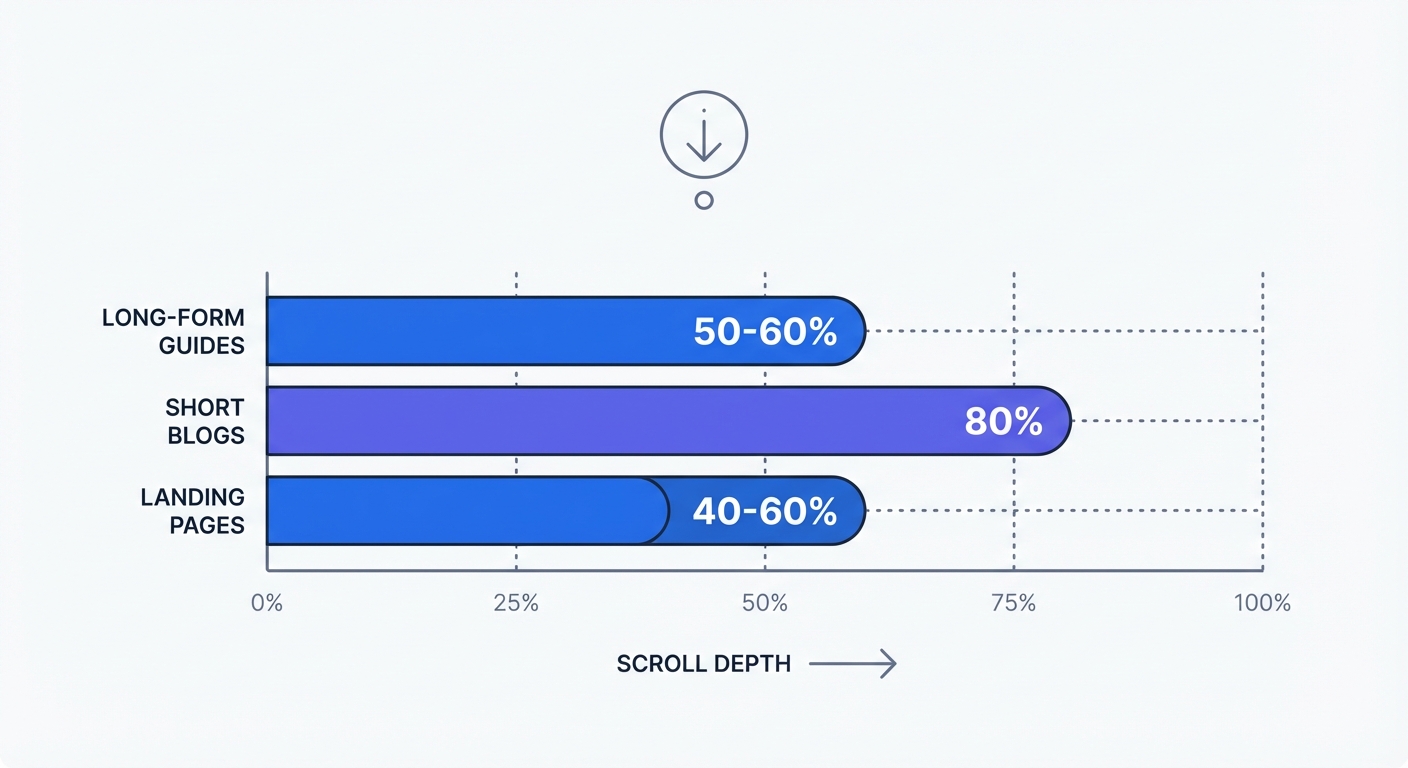
Webmasters dictate reader retention through page structure. Marketers use industry benchmarks to define standard expectations for different formats. Compare your internal metrics against these three averages.
- Long-form Articles: 50 to 60 percent average. You produce exceptional content if readers pass the 75 percent mark.
- Short Blog Posts: 70 to 80 percent average. Readers consume quick updates in a single session.
- Landing Pages: 40 to 60 percent average. You achieve success with lower depths by placing the primary conversion action above the drop-off point.
Map your specific website elements to these percentage zones. Place primary value propositions above the average drop-off cliff. You prove the effectiveness of your hero section when you record a low average scroll depth combined with a high conversion rate. Present the buy button to high-intent visitors without delay.
The False Bottom Problem
Designers disrupt downward momentum by placing oversized elements in the layout. A "false bottom" visual illusion occurs when a large image or a solid block of background color makes the layout appear finished. Users hit this barrier, assume the article has ended, and abandon the session.
Spot these false bottoms by looking for sharp drops in your milestone reports. If 80 percent of visitors hit the 25 percent mark but fewer than 10 percent reach the midpoint, inspect the specific elements between those two zones. Resize giant newsletter forms or excessive white space to restore the reading flow.
The Mobile vs. Desktop Divide
Segment your milestone reports by device to account for viewport dimensions. Desktop users reach the 50 percent mark with two mouse wheel clicks. Mobile visitors must perform multiple physical finger swipes to view the same material.
You identify poor user interface design by analyzing high drop-off rates on smartphones. Large sticky headers and unoptimized images push readable text below the fold. Shrink hero graphics on phone screens to pull the first paragraph into the initial viewport.
Compare the milestone differences between devices in your analytics platform. Redesign your mobile layout if phone users abandon the page 20 percentage points earlier than desktop readers. Smartphone visitors demand speed, so place the core answer under the primary headline.
The GA4 Problem And Tracking Limitations
Why 90 Percent Triggers Fail Marketers
Google includes vertical tracking via Enhanced Measurement. This default setting triggers an event upon a visitor reaching the 90 percent mark of a document. Marketers gain zero actionable insight from a basic completion flag, leaving mid-page abandonment zones unmonitored.
The majority of web traffic exits prior to the 90 percent threshold. You must collect data at the 25, 50, and 75 percent intervals to optimize the layout. Google omits these critical stops in default GA4 configurations. You cannot fix a content barrier at the midpoint if your software logs the visitors who view the footer.
The Tag Manager Burden
Developers must configure complex Google Tag Manager containers to capture mid-page milestones in GA4. The process requires building custom triggers and selecting individual percentage boxes. Teams then map specific variables and publish the updated code block.
Adding custom triggers increases the total payload weight of the website. Visitors experience slower load times as additional scripts execute. Slower rendering speeds cause the exact bounces you are attempting to measure. Install a native analytics solution to eliminate this technical debt.
Privacy Concerns And Ad Blockers
Traditional analytics setups rely on heavy JavaScript files and tracking cookies. Internet users install privacy extensions to block these scripts. Third-party software strips out Tag Manager containers to prevent corporate surveillance.
Users warp your behavioral metrics by running privacy extensions to block tracking scripts. Marketers lose visibility into a large segment of the technical audience. Basing optimization choices on this fragmented dataset leads to poor website redesigns.
Cookie-based platforms force webmasters to display intrusive consent banners. Visitors deny tracking permissions, resulting in immediate data loss. Web teams must adopt better measurement methods to respect user trust. Read about modern methods in our post on website visitor tracking to see the evolution of data collection.
Privacy-First Tracking With Swetrix
Cookieless Data Collection
Grasp what is scroll depth tracking without suffering the usual privacy trade-offs. Webmasters use Swetrix to log vertical milestones without injecting cookies into the browser. Implement this cookieless approach to bypass intrusive consent banners and keep identifiable personal information off your servers.
Maintain compliance with international privacy regulations by deploying a clean script. Site owners protect visitor anonymity while securing absolute visibility into content consumption. You retain total ownership of your metrics while blocking third-party access.
Webmasters ruin data accuracy by implementing intrusive consent banners. A visitor arrives on your landing page while the banner blocks the initial analytics script. The person reads the opening paragraph, rejects the product, and closes the tab without clicking the accept button. Analysts lose that critical bounce event, resulting in inflated engagement rates. Implement cookieless solutions to close this reporting gap. Read our article on 1st party cookies to understand the underlying mechanics.
Bypassing Ad Blockers For Accurate Reports
You bypass blocklists by running lightweight scripts. Extension developers target the heavy corporate trackers built to follow users between domains. Swetrix functions as a first-party tool to maintain browser trust.
Deploy a clean script to capture behavior from the total audience instead of tracking a limited segment who click accept. Analysts discover accurate averages by comparing an unblocked milestone report against a standard cookie-reliant export. Unrestricted recording yields a complete picture of reader habits. Base your website modifications on this full dataset.
Host our open-source analytics script on your own infrastructure to establish a permanent defense against blocklists. Engineers configure the tracking requests to originate from the host domain. The host browser interprets these internal pings as standard site functions.
Connecting Scroll Depth To Page Performance
Developers increase load times by shipping bloated code. Software teams prefer Swetrix to maintain a minimal footprint. Visitors scroll to greater depths on fast websites, whereas sluggish load times trigger instant session abandonment.
Monitor site speed alongside vertical engagement. Check our performance monitoring dashboard to isolate specific code bottlenecks. Visitors abandon sessions when a document takes five seconds to render. Fix the underlying load time to improve milestone completions without editing a single word of content.
How To Use Scroll Data To Boost Conversions
Finding The CTA Sweet Spot
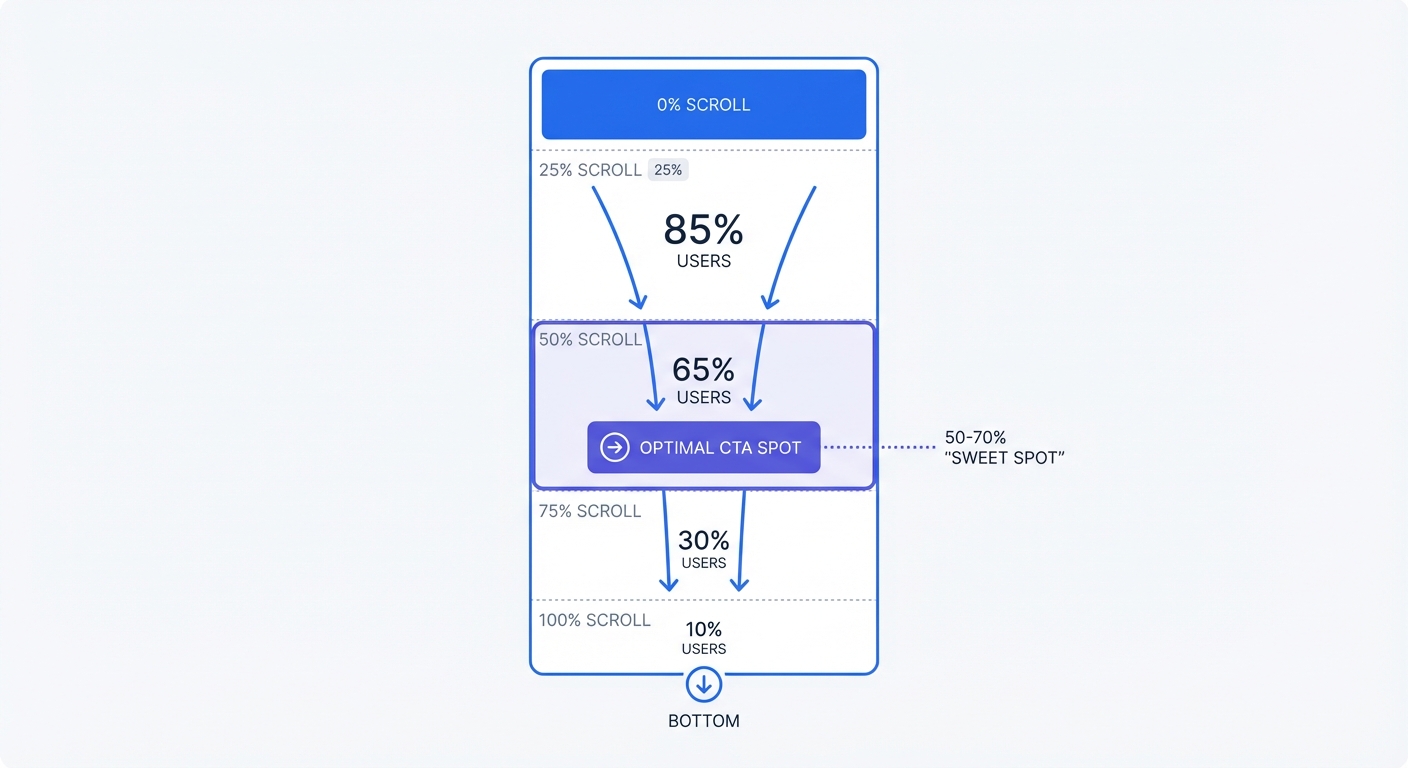
Audit revenue lost by tracking scroll milestones. Calculate the volume of visitors who bounce before seeing the primary buy button, then move those priority elements into the visible zones.
Place primary Call-to-Actions at the 50 to 70 percent interval. Human attention peaks within this specific corridor. Visitors demonstrate high purchase intent by reading past the midpoint. These readers understand their problem and want a solution.
Follow these steps to optimize placement:
- Open the scroll milestone report for the highest-traffic landing page.
- Identify the exact threshold where half the audience exits.
- Move the main CTA button ten percentage points above that exit line.
- Track the resulting conversion rate difference after seven days.
- Repeat this operation across all major sales pages.
Stop hiding major offers in the footer. A designer wastes potential revenue by placing a form at the bottom of a document if 80 percent of the traffic exits beforehand. Position the offer where the highest concentration of readers will see it.
Using Pattern Interrupters
Readers experience mental fatigue when facing massive text walls. Locate the exact paragraph causing this friction using vertical milestone reports. Repair these abandonment zones by inserting pattern interrupters.
Overhaul the layout if you detect a major exit spike at the midpoint. Insert a formatted quote block, an interactive widget, or an embedded video right at the 45 percent line. Breaking the visual monotony forces the reader to pause and reset their attention.
Humans crave visual variety. Webmasters trigger cognitive overload by publishing unformatted documents. Break up long sections using custom illustrations, bulleted lists, and bold callouts. Deploy different interrupters to find out which formats retain the highest number of visitors. Calculate the statistical significance of these retention experiments using our A/B test calculator.
Auditing Your Content Hierarchy
Journalists format news using the inverted pyramid structure to put primary facts in the first paragraph. Content marketers must adopt this identical hierarchy.
Analyze your vertical drop-off rates. You wrote a weak introduction if 60 percent of readers vanish before the 25 percent mark. Rewrite the opening to eliminate long background explanations. State the primary value proposition in the first sentence.
Push supporting details to the bottom of the article. Dedicated readers will pursue the minutiae, while casual visitors receive the core message before closing the tab.
Combining Metrics For True Context
Treat vertical tracking as a secondary diagnostic tool to pair with session duration metrics. You spot skimming behavior when a user jumps to the bottom within five seconds. You achieve definitive success when a visitor reads to the midpoint at a slow pace and then buys the product.
Optimize the layout for direct revenue generation. Users report a better experience when finding immediate answers at the top of the layout. You succeed if a visitor clicks an affiliate link in the first paragraph. Avoid burying information to inflate measurement metrics.
Append UTM parameters to outbound links to see which specific audiences read the furthest. Visitors arriving from organic search might consume 80 percent of a document, whereas social media clicks might exit at the first heading. Tailor the design based on the habits of the dominant audience. Build clean tracking URLs using our UTM generator to isolate these demographic differences.
Software vendors bury crucial behavioral data behind complex configurations and privacy-invading cookies. Webmasters require a clear picture of human interaction to build profitable websites. Measure authentic engagement by signing up for a 14-day free trial of Swetrix to access clean, cookie-free data.