- Date
What Is Performance Monitoring? A Complete Guide
 Andrii Romasiun
At its most basic level, performance monitoring is the continuous process of collecting data to understand how your website, app, or infrastructure is behaving from moment to moment. Think of it as a live EKG for your digital services. It's not about waiting for a system to flatline; it's about proactively keeping it healthy and responsive.
What Is Performance monitoring
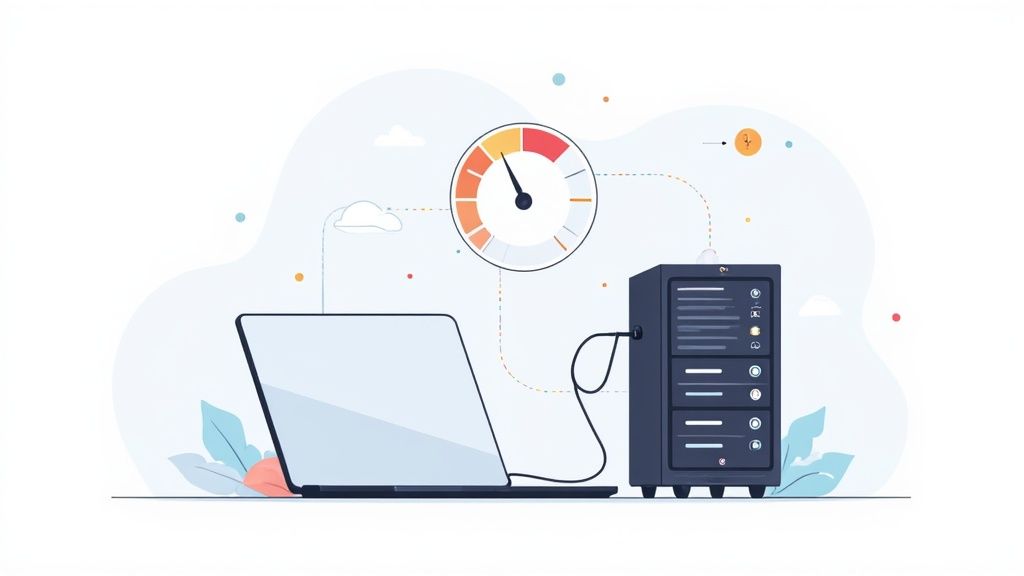
Picture your application as a complex machine with tons of interconnected gears. Performance monitoring is like attaching tiny sensors to every crucial part, from the server’s CPU usage all the way to a user clicking the "Add to Cart" button. It gathers all the telemetry data—metrics, logs, traces—and pieces it together to give you a clear, real-time view of system health.
This constant flow of data is what allows teams to finally break out of the reactive "break-fix" cycle. Instead of frantically trying to diagnose a crash after angry users flood your support channels, you can see the warning signs ahead of time—a database query that's suddenly taking too long or a subtle spike in error rates—and fix them before anyone even notices.
Why It Is Not Just a Technical Chore
While performance monitoring is built on technical data, its real purpose is to safeguard business outcomes. A sluggish e-commerce page leads directly to abandoned carts and lost sales. A glitchy mobile app results in a storm of one-star reviews and users deleting it for good. Monitoring is the bridge that connects these technical hiccups to their real-world financial impact.
When done right, a solid monitoring strategy delivers tangible results:
- Enhanced User Experience: You can find and squash performance bottlenecks, ensuring your users get a fast, smooth, and reliable experience every time.
- Increased Revenue and Conversions: A snappy, high-performing application is crucial for hitting business goals. It prevents slowdowns from killing your sales or sign-ups.
- Faster Troubleshooting: When things inevitably go wrong, monitoring gives your team the data they need to find the root cause in minutes, not hours, drastically cutting down on downtime.
- Informed Decision-Making: The data you collect can provide clear justification for a server upgrade, help prioritize the next development sprint, and focus your team’s effort on what actually matters to users.
Performance monitoring turns your system from an opaque black box into a transparent, observable environment. It gives you the visibility needed to build and maintain high-quality digital products that people will actually enjoy using.
Monitoring vs Analytics
It's easy to get performance monitoring confused with web analytics, but they serve two very different functions. Think of it this way: performance monitoring cares about the health and speed of the machine itself—how efficiently the code runs and how stable the servers are.
On the other hand, if you want to learn more about web analytics, you'll see it focuses entirely on user behavior—which pages they visit, what they click on, and how they navigate your site.
These two disciplines are two sides of the same coin. A sudden dip in user engagement in your analytics tool might be explained by a performance issue your monitoring system just picked up. Likewise, analytics can show you which user flows are the most popular, telling you exactly where to focus your performance monitoring efforts.
The Four Core Types of Performance Monitoring
To really get a handle on performance, you need to look at your system from a few different angles. A single viewpoint just won't cut it. Think about trying to understand a city by only watching traffic cameras—you’d see the cars, but you’d miss what it’s like to walk the streets, how well the subways are running, or if the power grid is stable.
A complete performance picture relies on four distinct, yet connected, types of monitoring. Each one gives you a unique lens, focusing on a different layer of your digital world. When you put them all together, you can trace the entire journey from a user's click all the way down to the server that processed it.
Let's break down these four essential pillars.
Real User Monitoring: Seeing Through Your Customer's Eyes
Real User Monitoring (RUM) does exactly what the name suggests: it gathers performance data straight from the browsers of your actual users. It’s like having thousands of customers instantly report back on their experience, telling you precisely how fast your site loaded for them, if they hit any snags, and how smoothly they moved from page to page.
RUM gives you invaluable, real-world context that you simply can't get any other way. A user in a rural area on a spotty 3G connection is going to have a wildly different experience than someone on a fiber line in a major city. RUM captures all that variation, giving you an honest look at how your app performs for everyone—not just in a perfect lab setting.
This approach is critical for understanding metrics that directly shape user satisfaction, like:
- Page Load Times: How long did it actually take for content to appear for real visitors?
- Interaction Delays: Was there a frustrating lag when someone clicked a button or tried to fill out a form?
- JavaScript Errors: Did any client-side bugs break the experience for them?
By looking at this aggregated data, you can spot trends affecting specific regions, browsers, or devices and focus your efforts on fixes that will make the biggest impact.
Synthetic Monitoring: Your Proactive "Secret Shopper"
While RUM tells you how your site is performing for real people, Synthetic Monitoring tells you how it should be performing under controlled conditions. This technique uses automated scripts to run through user journeys from various locations around the world, 24/7. Think of it as sending a team of secret shoppers to your digital storefront on a strict schedule to test all the important stuff.
These "robots" can perform key actions like logging in, adding an item to a cart, or completing a checkout. If any of these steps fail or take too long, you get an alert right away—often before a single real user is affected.
Synthetic monitoring is your first line of defense. It’s an early warning system that proactively catches outages, slowdowns, and broken user flows before they can hurt your customers or your revenue.
This proactive method is perfect for verifying uptime, setting performance baselines, and making sure your most critical business flows are always up and running as expected.
Application Performance Monitoring: The MRI for Your Code
Application Performance Monitoring (APM) takes you deep inside your own codebase. If RUM is the user’s view and Synthetic is the controlled test, APM is like an MRI for your application’s internal organs. It serves up detailed, code-level diagnostics that help developers find the exact source of a performance bottleneck.
APM tools trace individual requests as they travel through your backend services—from the moment a user clicks a button to the database query and all the way back. This lets you answer make-or-break questions like, "Which specific database call is bogging down the user profile page?" or "Why is this third-party API call timing out?"
This type of deep-dive monitoring is indispensable for keeping modern software healthy. It's no surprise that the global APM market, valued at USD 9.04 billion in 2024, is expected to hit USD 21.30 billion by 2032 as more companies realize how crucial a seamless experience is. For developers, a good APM tool is one of the best friends they can have for squashing bugs and optimizing code.
Infrastructure Monitoring: The Foundation Check-Up
Finally, we have Infrastructure Monitoring, which is the bedrock everything else is built on. This type focuses on the health and performance of the hardware and software that actually run your application—your servers, databases, containers, and network connections.
It keeps an eye on core system-level metrics, including:
- CPU Usage: Are your servers getting overworked, or are they just sitting around?
- Memory Utilization: Is your app eating up too much memory and at risk of crashing?
- Disk I/O: Are slow hard drives creating a bottleneck for your database?
- Network Latency: Are there communication delays between your different services?
Without a stable infrastructure, even the most beautifully written code will fall flat. Infrastructure monitoring makes sure that foundation is solid, giving you confidence that your servers have the resources they need to deliver a fast, reliable experience.
Comparing The Four Main Types of Performance Monitoring
Each of these monitoring types offers a unique perspective. To make it easier to see how they fit together, here's a quick side-by-side comparison.
| Monitoring Type | Primary Goal | Data Source | Best For |
|---|---|---|---|
| Real User Monitoring (RUM) | Understand real-world user experience and impact. | Actual user browsers and devices. | Measuring user satisfaction, finding frontend bugs, and understanding performance across diverse conditions. |
| Synthetic Monitoring | Proactively detect outages and baseline performance. | Automated scripts from global locations. | Uptime monitoring, alerting on critical user path failures, and SLA compliance. |
| Application Performance Monitoring (APM) | Diagnose and fix code-level performance issues. | Server-side agents and code instrumentation. | Pinpointing slow database queries, identifying inefficient code, and debugging backend errors. |
| Infrastructure Monitoring | Ensure the health and capacity of underlying systems. | Servers, containers, databases, and networks. | Preventing resource exhaustion (CPU, memory), tracking system health, and capacity planning. |
By combining these four approaches, you move from just collecting data to building a truly comprehensive understanding of your system's health—from the metal all the way to the end-user.
Critical Performance Metrics You Need to Track
You can't fix what you can't measure. But effective performance monitoring isn't about drowning in data; it's about focusing on the right signals that tell you what’s really going on with your system and, more importantly, with your users' experience.
To make sense of it all, it helps to organize these signals into three distinct layers. Think of them as different lenses: one focused on the customer's direct experience, another on your application's internal health, and the last on the stability of the servers and services propping everything up.
This diagram shows how different monitoring tools feed data into these layers, giving you a complete picture of performance from every angle.
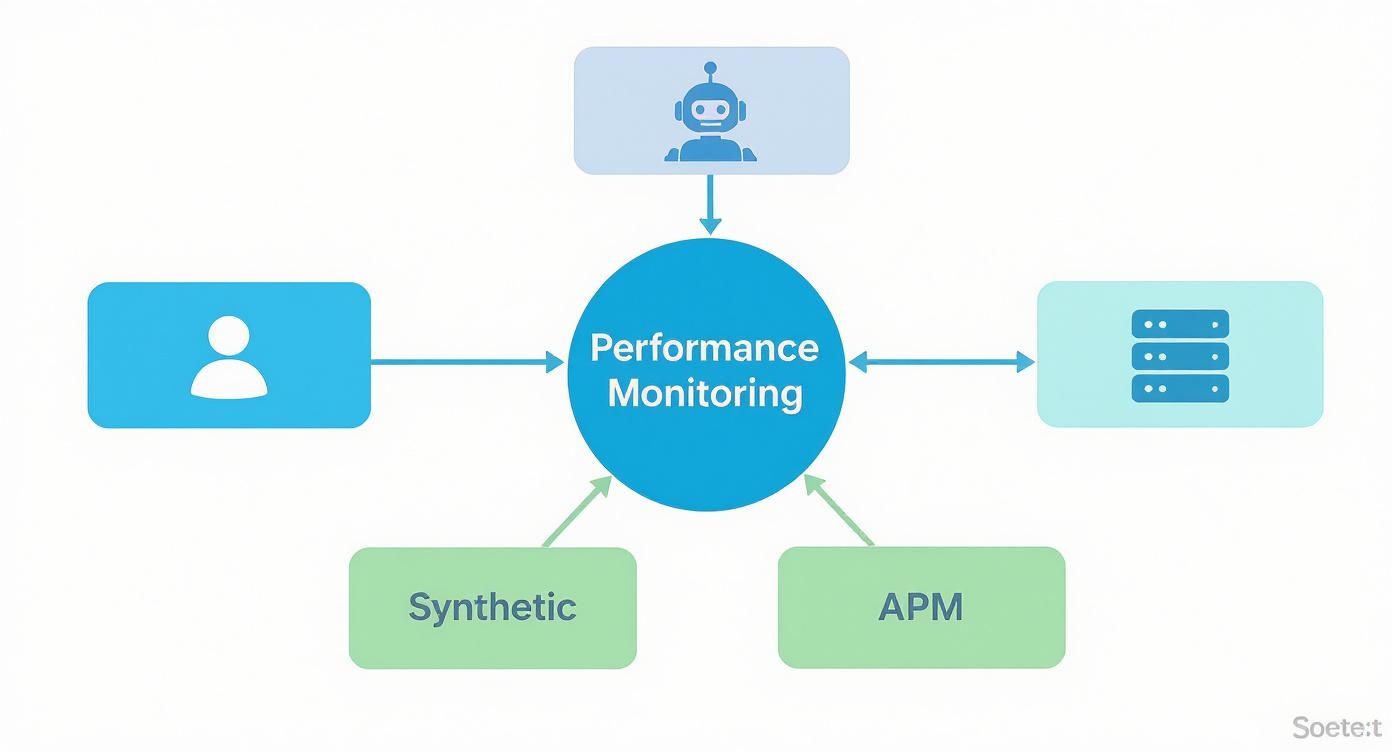
As you can see, a solid strategy pulls together real user data, synthetic checks, application code analysis, and infrastructure stats to build that single, unified view of system health.
User-Facing Performance Metrics
These are the numbers your customers feel. When these metrics head south, so do user satisfaction and your conversion rates. They are the ultimate report card for your digital experience.
Here’s what to keep an eye on:
- Page Load Time: The classic. It's the total time it takes for your page to appear in a user's browser. Even a one-second delay can cause a painful drop in conversions.
- Core Web Vitals (CWV): This isn't just a buzzword; it's a set of specific benchmarks from Google that directly impact your SEO rankings. They measure loading (Largest Contentful Paint), interactivity (First Input Delay), and visual stability (Cumulative Layout Shift).
- Time to First Byte (TTFB): This one measures how long a browser waits just to get the first piece of data from your server. A high TTFB is a dead giveaway that your backend is sluggish, even if the rest of the page loads in a snap.
Performance isn't just about raw speed, either. It directly influences how people interact with your site. To connect the dots, it helps to understand what makes for a good average engagement time and see how poor performance can tank it.
Application Health Metrics
While your users won't see these numbers on a dashboard, they will definitely feel the consequences. Application metrics are your diagnostic tools—they tell you how your code is holding up under real-world pressure. When something feels "off," this is where developers look first to hunt down bugs and bottlenecks.
Think of these metrics as your application's vital signs. A sudden spike in error rate is like a fever—it’s a clear signal that something is wrong internally and needs attention before it starts affecting your users.
Key metrics for your application's health include:
- Error Rate: The percentage of requests that end in failure (like a dreaded 500 Internal Server Error). You want this number as close to zero as possible. A sudden jump is a major red flag.
- Response Time (Latency): How long does your app take to process a request and send back an answer? Tracking the average and 95th percentile helps you see the experience for both typical users and the unlucky few getting the slowest responses.
- Throughput: This is simply the number of requests your application handles per minute. It’s crucial for capacity planning and tells you how your system behaves when traffic gets heavy.
Infrastructure Stability Metrics
Finally, we get down to the foundation: the hardware and services your application actually runs on. If a problem starts here, it will inevitably cascade upwards and take everything else down with it. Keeping this layer stable is non-negotiable.
Here are the essentials for infrastructure:
- CPU Usage: This tracks how hard your server's processor is working. If it's consistently running hot—often above 80%—you're heading for slowdowns or even a full-blown crash.
- Memory Utilization: This shows how much RAM is being used. If an application becomes a memory hog, the operating system might just decide to shut it down completely to save itself.
- Disk I/O: Measures how fast your storage can read and write data. For database-heavy applications, slow disk performance is a notorious bottleneck.
By watching metrics across all three of these areas—user experience, application health, and infrastructure stability—you build a powerful framework that connects a line of buggy code directly to its impact on your bottom line.
Building Your Performance Monitoring Strategy
Having the right monitoring tools is a great start, but they’re only as good as the plan you have for using them. A solid strategy turns performance monitoring from a reactive, fire-fighting exercise into a proactive engine for growth and stability. It's about shifting from just collecting data to asking the right questions.
Think of it like building a house. You wouldn’t just show up with a pile of bricks and start stacking. You’d have a blueprint. Your monitoring strategy is that blueprint—it guides how you collect, analyze, and act on performance data to support your actual business goals. This plan keeps your efforts focused and tied directly to what matters.
Define Your Business Objectives First
Before you get lost in the sea of tools and metrics, take a step back and start with the "why." What are the most critical outcomes for your business? A truly effective strategy connects technical performance directly to tangible business results.
For example, your objectives might look something like this:
- Boost conversion rates: An e-commerce site might aim to keep the entire checkout process under two seconds, no exceptions.
- Slash customer churn: For a SaaS app, the goal could be to hunt down and eliminate the frustrating bugs that make users give up.
- Protect your brand reputation: A media outlet can’t afford downtime during a major event, so maintaining 99.99% uptime is non-negotiable.
When you define these goals first, you create a powerful filter for every decision you make later. You’ll know exactly which user journeys need the most attention and which performance thresholds are actually important.
Choose The Right Mix Of Tools
The performance monitoring world is huge and getting bigger. The global market is projected to hit an incredible USD 69.57 billion by 2030, largely thanks to AI-powered analysis that helps teams pinpoint issues faster than ever. You can read more about the growth of the monitoring tools market and what's driving it.
The trick is to pick a combination of tools that covers all your bases—RUM, synthetic, APM, and infrastructure—without making your life more complicated. A common approach is pairing a real-user monitoring tool to see what customers actually experience with an APM solution to dig into the backend code. Many modern platforms now bundle these into a single, unified dashboard. If you're looking for options, we have a great guide on the best website performance monitoring tools.
Instrument Systems and Configure Alerts
Once you’ve selected your tools, it’s time for instrumentation. This is simply the process of integrating them into your applications and infrastructure so they can start collecting data. It might be as simple as adding a JavaScript snippet to your website’s header or deploying a small agent on your servers. The goal is to get a clean, reliable stream of data flowing.
But raw data is just noise. The real magic happens when you set up smart alerts that tell you about real problems without flooding your team with notifications.
A good alert is specific, actionable, and rare. It shouldn't just say "something is slow." It should tell you, "Checkout API response time is over 3 seconds," giving you a clear starting point for your investigation and cutting through the clutter of minor dips and spikes.
Protect User Privacy By Design
These days, you can't talk about monitoring without talking about data privacy. Regulations like GDPR have set clear, strict rules for collecting and processing user data. A responsible monitoring strategy doesn't treat privacy as an afterthought; it bakes it in from the very beginning.
Here’s how to get it right:
- Anonymize Data: Make sure any personally identifiable information (PII), like full IP addresses or user IDs, is either never collected or is fully anonymized before it’s stored.
- Respect User Consent: Your monitoring practices must honor your site's cookie and consent policies. If a user opts out of tracking, your monitoring scripts need to respect that decision, period.
- Minimize Data Collection: Only gather what you truly need. Don't collect sensitive information that has nothing to do with system health or performance.
By putting privacy first, you can get the powerful insights you need to improve your product while building trust with your users and staying fully compliant.
Turning Monitoring Data into Business Decisions
Collecting performance data is just the starting point. The real magic happens when you use that data to make smarter, faster decisions. When done right, performance monitoring stops being a technical dashboard full of squiggly lines and becomes a strategic asset that guides your product roadmap, justifies new infrastructure, and directly impacts your bottom line. It's the bridge between system health and business health.
This isn't just a niche discipline anymore; it's a core function for any modern company. It’s about systematically checking how well your tech is running to make sure every component is actually helping you hit your business goals. The demand for this kind of real-time, data-driven insight is exploding. North America, for instance, holds a massive 37.7% share of the market in 2024, which tells you how quickly companies are going all-in on digital. You can find more details on this growth in the global performance analytics market report.
This is exactly where your monitoring setup graduates from simply fixing problems to actively preventing them—and ultimately, driving growth.
A Practical Troubleshooting Scenario
Let’s get concrete. Imagine you run an e-commerce website. You walk in on a Monday morning and see that weekend conversion rates tanked by 15%. That’s a serious financial hit. Without a proper monitoring system, your team is in full-blown panic mode, guessing at what went wrong. Was it a marketing campaign? A competitor's sale? A bug from the last code push?
Now, picture the same scenario with a solid monitoring system in place. The workflow is night and day:
- Detection: An alert automatically fires, telling you the
api/checkoutendpoint response time jumped by 300ms right after the last deployment. - Correlation: You glance at your dashboard and see the slowdown lines up perfectly with the drop in conversions. Boom—you’ve just connected a technical problem directly to a business outcome.
- Diagnosis: Your APM tool dives into the slow requests and pinpoints the culprit: an inefficient database query for inventory checks. What used to take milliseconds is now taking seconds.
- Resolution: Your developers can ship a targeted fix for that specific query. Within an hour, performance is back to normal, and you can see conversion rates start to climb again.
This whole process gets resolved in a fraction of the time it would take to manually investigate, saving potentially thousands in lost revenue.
From Reactive Fixes to Proactive Strategy
While putting out fires is critical, the true power of performance monitoring is in shaping your long-term strategy. The data you gather gives you hard evidence to drive key business and product decisions, transforming technical insights into a seriously persuasive tool.
The goal is to move from asking, "What just broke?" to asking, "What can we improve next?" Performance data gives you the answer, showing you exactly where to invest your resources for the biggest impact.
Your monitoring data helps you answer the tough questions that define your roadmap:
- Should we invest in new infrastructure? By tracking CPU and memory usage over time, you can predict exactly when you’ll outgrow your current servers. This data builds a rock-solid business case for an upgrade before your site starts slowing down and frustrating customers.
- Which features should we prioritize? If monitoring reveals that your most popular feature is also your slowest, it instantly becomes a top candidate for optimization in the next sprint.
- What’s the ROI of our engineering work? After a big refactor or a performance-focused sprint, you can point to the data and show a measurable improvement in response times, error rates, and—most importantly—in user satisfaction and conversion metrics.
By consistently tying technical metrics to business KPIs, engineering teams can stop being seen as a cost center and start proving their direct contribution to the company’s biggest goals.
Putting Performance Monitoring Into Practice: Your Action Plan

Knowing what performance monitoring is doesn't do much on its own. The real value comes when you put that knowledge into action. And you don't need a massive enterprise suite to get started—you can begin taking targeted steps today, no matter what your role is.
Think of performance as a team sport. Developers, product managers, and engineering leads all have a crucial part to play. A solid strategy brings everyone to the table, creating a culture where performance isn't just an engineering problem, but a shared priority.
Next Steps for Every Role
Let's get practical. Here’s how different team members can start making an immediate impact.
For Developers & Startups: Start small and stay focused. Pick your single most critical user journey—the sign-up flow, the checkout process—and monitor it. You can implement a free or open-source tool to track Core Web Vitals and keep an eye on front-end error rates. This gives you high-value insights right away without breaking the bank.
For Product Managers: Performance data is your secret weapon for making better decisions. Did conversion rates drop at the same time API latency spiked? Now you have hard evidence to push for a tech debt sprint. You can frame these fixes not as tedious chores, but as direct investments in keeping users happy and hitting business goals.
For Engineering Leaders: Your job is to make performance everyone’s responsibility. Create dashboards that clearly connect your team’s work to business KPIs. When you can show how an infrastructure upgrade boosted revenue or reduced churn, you're not just managing a cost center—you're proving your team is a strategic driver of growth.
When you take these focused actions, performance monitoring becomes part of your team's DNA. You stop just reacting to fires and start proactively building a faster, more reliable product. That's the real win.
Common Questions About Performance Monitoring
When teams first start digging into performance monitoring, the same few questions always seem to pop up. Getting these cleared up early is key to building a strategy that actually works, whether you're a scrappy startup or a big company. Let's walk through some of the most common ones.
Monitoring vs. Observability: What's the Difference?
You'll hear the terms monitoring and observability thrown around, often together, but they’re not the same thing. Think of it as an evolution.
Monitoring is about asking questions you already know are important. You set up a dashboard to watch CPU usage because you know that if it spikes, something’s probably wrong. It’s a predefined checklist for system health.
Observability is what you need when systems get so complex that you can't possibly predict every single way they might fail. It’s about having such rich data (from logs, metrics, and traces) that you can ask brand new questions on the fly to figure out what's going on.
Monitoring tells you if something is wrong. Observability helps you figure out why it's wrong, even if it's a problem you've never seen before.
Will Monitoring Slow Down My Application?
This is probably the most common worry. It’s a fair question, and it has a name: monitoring overhead. It refers to the resources your monitoring agent uses just to do its job.
Years ago, some older tools could be clunky and definitely slowed things down. But modern performance monitoring tools are built to be incredibly lightweight. They're designed from the ground up to have a negligible footprint on your app's performance. A well-built agent will sip a tiny amount of CPU and memory, so the insights you get are almost always worth the tiny cost.
How Much Does Performance Monitoring Cost?
The price tag can be anything from zero to tens of thousands of dollars a month. It all comes down to your scale and what you need, and thankfully, there are options for every budget.
Here’s a rough breakdown of what you'll find:
- Open-Source Tools: Tools like Prometheus and Jaeger are fantastic and completely free. The catch? You're on the hook for setting them up, maintaining them, and covering all the hosting costs. It's a great path for technical teams who don't mind getting their hands dirty.
- SaaS Platforms: This is the "it just works" option. Commercial tools give you a polished interface, customer support, and tons of advanced features right out of the box. Their pricing usually scales with your usage—based on things like data volume or the number of servers you're monitoring—so you can start small and grow.
Ready to see your website's performance with a privacy-first approach? Swetrix provides clear, actionable insights, including real-user monitoring and error tracking, without cookies or intrusive tracking. Start your 14-day free trial today and take control of your data.