- Date
What Is Anomaly Detection? A Guide to Finding Critical Web Traffic Issues
 Andrii Romasiun
Anomaly detection is all about spotting the odd one out. It’s the process of finding data points, events, or patterns that just don’t fit with the rest. Think of it as a smart alarm system for your website's data, one that can flag trouble long before it spirals into a full-blown disaster.
Your Website's Digital Smoke Detector
Picture your website as a bustling building. People come and go every day, moving between floors and rooms in a fairly predictable rhythm. You have the morning rush, the quieter afternoon period, and the evening browsing session. But what happens if a small, unnoticed fire starts smoldering in a server room? You might not realize anything is wrong until smoke starts billowing down the hallways, causing chaos and real damage.
This is where anomaly detection comes in. It acts as your building’s digital smoke detector. It constantly monitors the flow of data, learning the normal, everyday pulse of your site's traffic, user behavior, and performance metrics. It's not watching individuals; it’s looking at the collective patterns.
When something suddenly breaks from this established baseline, the alarm goes off. This "smoke" could be any number of things:
- A Sudden Traffic Drop: Maybe a major referral source is down, or a recent search engine update just tanked your rankings.
- An Error Spike: Did that last code push introduce a bug that’s now crashing pages for a specific group of users?
- A Plunge in Conversions: Is your payment gateway throwing errors, or is a broken "Add to Cart" button silently costing you sales?
Why Anomaly Detection Is Essential
Without a system like this, you’re stuck manually digging for problems, usually only after a customer has complained or you’ve already seen a hit to your bottom line. Anomaly detection automates that vigilance, turning your raw data into a proactive defense system. The goal isn’t to watch every single person but to get a clear picture of your website’s overall health.
The real power of anomaly detection lies in its ability to uncover the "unknown unknowns"—those critical issues you weren’t even looking for but absolutely need to know about right now. It shifts your entire approach from reactive firefighting to proactive site management.
To give you a clearer picture, here's a quick breakdown of the core ideas.
Core Concepts of Anomaly Detection at a Glance
| Concept | Simple Explanation | Example in Web Analytics |
|---|---|---|
| Baseline | The "normal" or expected pattern of your data over time. | Your average number of daily visitors is 10,000, with a peak every Tuesday morning. |
| Anomaly | A data point or event that significantly deviates from the established baseline. | Suddenly, your daily visitors drop to 2,000 without any warning or marketing changes. |
| Signal vs. Noise | Differentiating a true problem (signal) from a random, insignificant fluctuation (noise). | A 1% dip in traffic is likely noise. A 75% drop is a clear signal that something is wrong. |
This table shows just how simple the underlying principles are, but their application is incredibly powerful.
This is especially true in a privacy-first world. By focusing on aggregated, anonymous patterns, you gain powerful insights without compromising user privacy. For anyone running a website, getting a handle on the fundamentals of what web analytics is is the starting point. Anomaly detection is the critical next step. It gives you the alerts you need to protect the user experience, safeguard revenue, and get some peace of mind, knowing a silent guardian is always on watch.
Exploring Different Anomaly Detection Methods
To really get a handle on anomaly detection, you have to look under the hood at the different engines that power it. They're not all created equal; each has its own way of working, its own strengths, and specific situations where it shines. Think of them as different specialists you’d call in, each with a unique skill set for sniffing out problems.
The easiest way to group these approaches is by how much they know ahead of time. Some lean on proven mathematical principles, others follow strict rules we give them, and the most sophisticated ones actually learn the unique rhythm of your data all on their own. Picking the right one really boils down to the kind of data you're working with and what you’re trying to find.
This diagram gives a great high-level view of how anomaly detection works, essentially sorting data points into "normal" and "something's weird here" buckets.
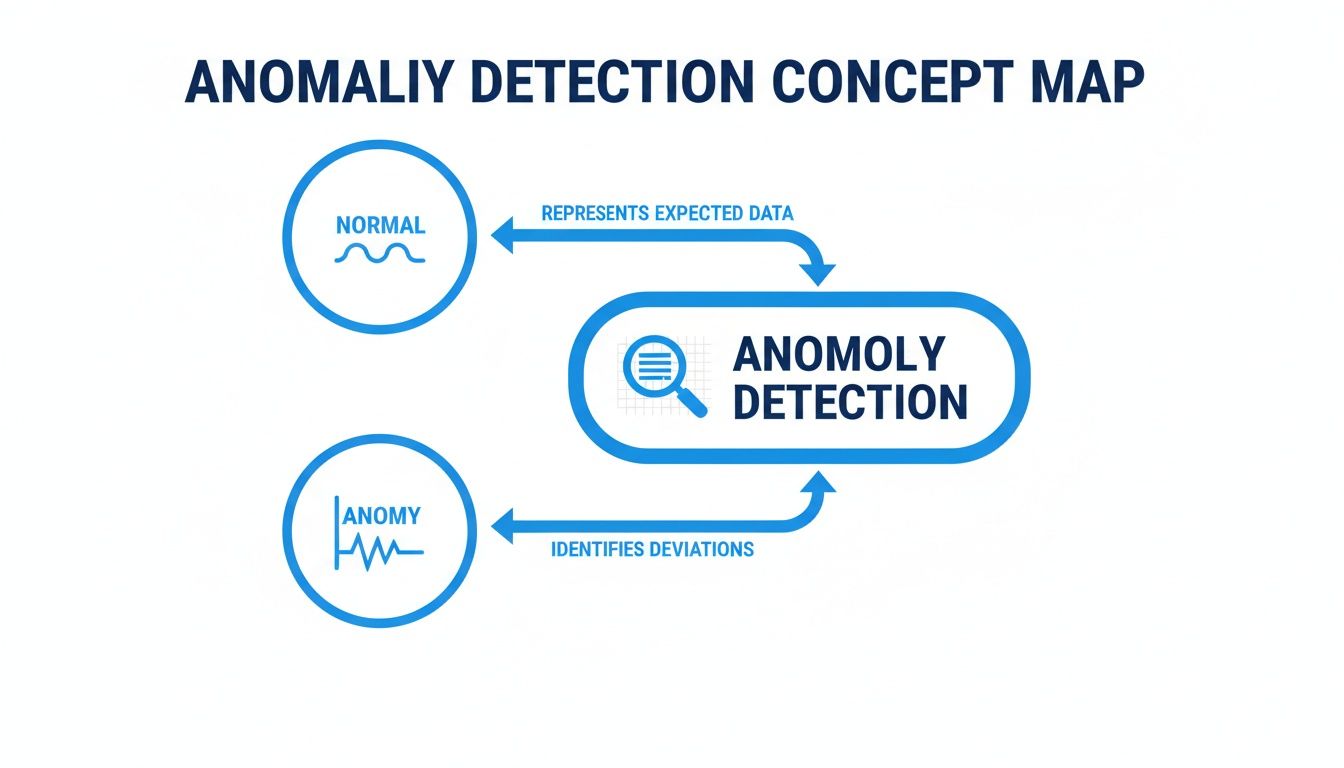
Ultimately, the name of the game is separating the predictable, everyday behavior from those unexpected spikes and dips that are worth your attention.
Statistical Methods: The Seasoned Expert
Statistical anomaly detection is the old-school, traditional approach. It’s like a seasoned shopkeeper who’s seen decades of foot traffic. They don't need a fancy algorithm to know that having only five customers by noon on a Saturday is just plain wrong. This method uses statistical models to draw a clear line around what’s “normal” for your data.
It works by calculating metrics like the mean, standard deviation, and overall distribution to establish a baseline. Any data point that wanders too far outside this calculated norm gets flagged. These techniques are solid because they're grounded in proven mathematical principles, making them very reliable.
A classic example is flagging any data point that falls more than three standard deviations from the average. It’s a dependable way to catch big outliers without drowning in false alarms.
Statistical methods are the bedrock of anomaly detection. They provide a quantifiable, evidence-based way to define normalcy and identify deviations, making them a transparent and trustworthy starting point for any monitoring strategy.
Of course, modern platforms take this idea much further. They can employ statistical techniques tailored to different time frames, automatically adjusting for holidays and seasonality. For instance, a system might build a reference period of up to 35 days and compare it to the same period a year ago, using functions that account for things like leap days or major shopping events like Black Friday.
Rule-Based Methods: The Digital Tripwire
If statistical methods are all about knowing what's normal, rule-based methods are about knowing what's explicitly wrong. This approach is less about complex math and more about setting specific, human-defined tripwires. You basically create a list of "if-then" rules that fire off an alert when triggered.
It's just like setting up security rules for a building:
- If the number of 404 "Page Not Found" errors shoots past 100 in an hour, then send an alert.
- If the server response time stays above 3 seconds for more than five minutes, then notify the DevOps team.
- If the checkout completion rate drops below 50% of its daily average, then flag a potential payment issue.
This method is incredibly straightforward and perfect for problems you already know about. A spike in 404 errors is always bad, so you create a rule to watch for it. The biggest downside? It can’t catch the "unknown unknowns"—the problems you haven't anticipated and, therefore, haven't written a rule for.
Machine Learning Methods: The Adaptive Detective
Machine learning (ML) brings a more dynamic and adaptive approach to the table. Instead of relying on fixed statistical models or predefined rules, ML algorithms actually learn the unique and complex patterns of your data over time—including seasonality, trends, and how different metrics relate to each other. This method is like an adaptive detective who learns the specific rhythm of your website and can spot when the beat is just slightly off.
There are a couple of flavors of ML-based detection:
- Supervised Learning: This is where you train the model with a labeled dataset that has examples of both "normal" and "anomalous" data. The model learns to tell the difference. It's highly accurate but takes a lot of upfront work to label all that data.
- Unsupervised Learning: This is the go-to approach for web analytics. You give the model unlabeled data, and it figures out the definition of "normal" all on its own. It then flags anything that deviates from that learned pattern. This is perfect for discovering new issues you didn't even know to look for.
ML really shines when you're dealing with high-dimensional data, where lots of metrics influence one another. It can understand the complex relationship between traffic sources, user device types, and conversion rates, flagging an anomaly that simpler methods would completely miss. If some of these underlying concepts are new to you, it might be helpful to read up on the principles of what is statistical significance to get a better feel for how these models make their judgments.
Comparing Anomaly Detection Approaches
Choosing a method isn't about finding the "best" one, but the right one for your specific needs. Each approach has its trade-offs, from simplicity and transparency to power and adaptability. This table breaks down the core differences to help you see where each one fits best.
| Method | How It Works (Analogy) | Best For... | Key Limitation |
|---|---|---|---|
| Statistical | The Seasoned Expert who knows the normal daily rhythm based on years of experience. | Stable environments with predictable patterns and a need for clear, mathematically-backed alerts. | Can be too rigid; may struggle with complex seasonality or rapidly changing "normal" behavior. |
| Rule-Based | The Digital Tripwire that triggers an alarm when a specific, pre-set condition is met. | Catching known, critical issues where the failure conditions are well-defined (e.g., error counts). | Can't detect novel or unforeseen problems ("unknown unknowns"); requires manual updates. |
| Machine Learning | The Adaptive Detective that learns on the job, constantly refining its understanding of normal behavior. | Complex, dynamic systems with many interacting variables; discovering brand-new types of anomalies. | Can be a "black box," making it hard to understand why something was flagged; requires more data. |
Ultimately, many of the most effective anomaly detection systems don't just pick one method; they blend them. You might use rule-based alerts for your absolute show-stoppers while letting a machine learning model hunt for more subtle, emerging issues in the background.
Real-World Examples in Privacy-First Web Analytics
Alright, let's move beyond the theory and see how anomaly detection actually plays out in the wild—specifically within a privacy-first analytics setup. These aren’t just abstract concepts; they are real-world scenarios that product managers, marketers, and founders bump into all the time.
The most important takeaway here is that you can uncover these critical insights without creepy cookies or tracking individual users. That's what makes this such a powerful tool for ethical data analysis.
By focusing on aggregated, anonymous signals, you can spot systemic issues that affect all your users while respecting the privacy of every single one. Let's walk through a few common situations.
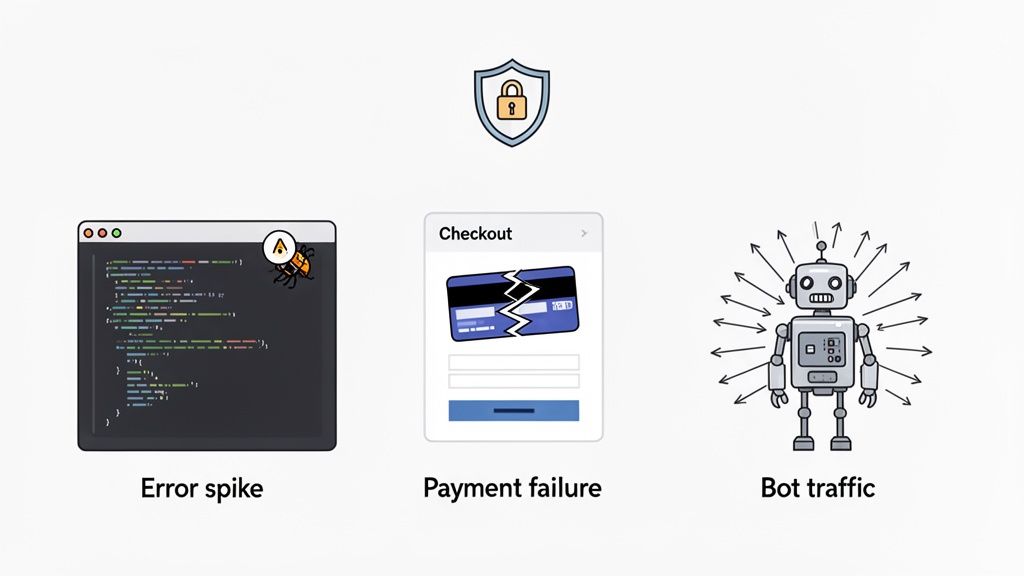
Catching Costly JavaScript Errors After a Deployment
Picture this: your dev team pushes a new feature live on a Friday afternoon. Classic. Over the weekend, everything seems fine on the surface. But lurking beneath, a subtle JavaScript bug is breaking a core function for anyone using a specific browser version. Users are getting frustrated and bouncing, but since the site isn't completely down, nobody notices.
Without anomaly detection, this problem could drag on for days, maybe even a week, until the customer support tickets start piling up. With it, the story is completely different.
Your analytics tool is constantly monitoring error rates in aggregate. It immediately spots a sudden, dramatic increase in a specific JS error and automatically fires off an alert to your team's Slack channel.
- The Anomaly: A 300% spike in
"TypeError: Cannot read properties of null"coming from your new checkout module. - The Likely Cause: The new code just shipped is incompatible with an older, but still widely-used, browser.
- The Decisive Action: The dev team gets the alert, rolls back the problematic code, and deploys a quick hotfix. A potential revenue disaster is completely avoided before anyone even gets their coffee on Monday morning.
Identifying a Broken Payment Flow and Plugging Revenue Leaks
Now, imagine you run an e-commerce site and your third-party payment provider is having a service hiccup. Your website is still up, people can add items to their cart, but the final "Pay Now" button is silently failing. From a top-level traffic perspective, nothing looks wrong at all.
This is exactly where monitoring conversion funnels with anomaly detection becomes a lifesaver. Your system knows the typical, expected drop-off rate at each step of your checkout process. When that payment gateway fails, the system sees a massive deviation from the baseline.
- The Anomaly: The conversion rate from the "Enter Payment Details" page to the "Order Confirmation" page plummets from its usual 85% down to just 10%.
- The Likely Cause: A third-party payment API is down or returning errors.
- The Decisive Action: An alert is triggered, and the team jumps on it. They can immediately pause the marketing spend that's driving traffic to a broken funnel and put up a notice on the site. This protects both the ad budget and, more importantly, customer trust.
Unmasking a Bot-Ridden Referral Campaign
Here’s another classic. You just launched an exciting referral campaign with a new partner. You see a huge surge in traffic coming from their link and start celebrating a massive success. But then you look closer. Your bounce rate has gone through the roof, and not a single one of these new "visitors" has signed up or even clicked a second page.
Without anomaly detection, you might waste weeks of your marketing budget on a completely worthless traffic source. A smart system, however, looks at multiple metrics together. It sees that while traffic is way up, related metrics like engagement, session duration, and conversion rates are behaving in a way that just doesn't make sense.
This is a textbook sign of bot traffic.
- The Anomaly: Traffic from one specific referral source shows a 99% bounce rate and an average session duration of <1 second—statistically impossible for human beings.
- The Likely Cause: The partner is sending you low-quality or downright fraudulent bot traffic just to hit their click targets.
- The Decisive Action: You can pause the campaign immediately and go back to your partner with hard data. This stops the financial bleed and keeps your analytics clean and reliable for making future decisions.
In every one of these examples, the crucial insights come from collective, anonymized data patterns—not from watching what individuals do. This is what makes anomaly detection an essential tool for anyone serious about building a better, more reliable website while championing privacy-friendly analytics.
How to Actually Implement Anomaly Detection and Set Up Smart Alerts
Alright, let's move from theory to practice. Knowing what anomaly detection is is one thing, but making it work for you is where the real value kicks in. Setting up a system to keep an eye on your website doesn’t have to be a massive undertaking. The goal is simple: create a smart, automated watchdog that flags real problems without drowning you in constant, meaningless notifications.
Here's a practical roadmap to get you from zero to a monitoring system your team can actually trust.
First, Define What "Normal" Looks Like
Before you can spot anything unusual, you have to know what "usual" is. This is your baseline. Trying to monitor every single metric right away is a recipe for disaster—you'll just end up with a constant stream of alerts that everyone learns to ignore.
Instead, start small. Pick a handful of metrics that truly matter to your business. We're talking about the vital signs of your website:
- Conversion Rate: Are people signing up or buying things at the expected rate?
- Revenue: Is money coming in as it should? This is a big one for e-commerce.
- Top-Level Error Counts: Are critical errors like JavaScript exceptions or 500s suddenly spiking?
- Page Load Times: Is the site suddenly grinding to a halt for users?
Your analytics tool needs enough historical data for each of these to learn the natural rhythm of your site—the daily ebbs and flows, the weekly cycles, and even seasonal shifts. This baseline is the bedrock of your entire detection system.
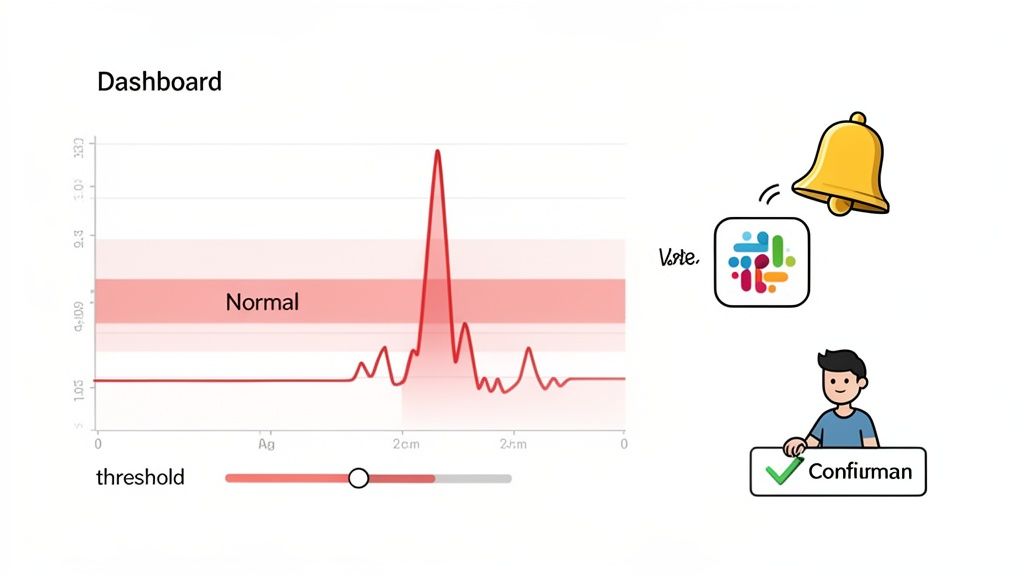
Next, Configure Your Alert Thresholds Intelligently
With a baseline established, it's time to set your tripwires. This is where art meets science. Set your alert thresholds too loosely, and you'll sleep through a crisis. Set them too tight, and your Slack channels will blow up with "emergencies" that are really just minor hiccups.
Modern tools like Swetrix give you fine-grained control here. You can create smart alerts that only trigger when a metric deviates by a specific percentage or a raw number over a certain period.
For example, you might set up an alert to catch a sudden drop in user activity, ensuring you only get notified when the change is significant enough to warrant attention. The trick is to start with conservative thresholds. You can always tighten them later as you get a better feel for what level of deviation is actually a problem for your business.
Get Alerts into Your Team's Workflow
An alert that no one sees is completely useless. To make this system work, the notifications have to land right where your team already lives and breathes. You want to deliver the right information to the right people, instantly.
A successful alerting strategy isn't just about detecting anomalies; it's about closing the loop between detection and action. Timely notifications delivered to collaborative tools like Slack or Discord transform a data point into a conversation, and a conversation into a solution.
Think about it: when an alert for a revenue drop fires, it should pop up in the #finance Slack channel. When the error rate goes through the roof, that message needs to hit #dev-alerts immediately. This way, the context is delivered right where the conversation can start, and your team can jump on the problem without missing a beat.
Finally, Validate Anomalies and Fine-Tune the System
No automated system is perfect on day one. A critical, ongoing part of the process is having a human in the loop to validate and tune everything. When an alert goes off, someone on your team needs to ask: "Is this a real fire, or just a false alarm?"
This feedback is what makes the system smarter over time. Was that traffic spike a bot attack, or was it the result of a brilliant marketing campaign that just went viral? The system can learn to tell the difference.
It's actually pretty amazing how quickly some machine learning systems can adapt. Some platforms can start flagging high-confidence anomalies within just 10 minutes of seeing new data, getting more stable within hours. Over time, these AI-powered systems rapidly eliminate noise and get laser-focused on what matters.
By consistently checking alerts and tweaking the sensitivity, you'll gradually build a monitoring system that's less noisy and far more reliable—one your team can depend on to surface only the issues that truly need their attention.
Best Practices for Avoiding Common Pitfalls
Flipping the switch on an anomaly detection system is the easy part. Getting it to produce genuinely useful insights instead of a constant stream of noise? That's where the real work begins. The line between a powerful monitoring tool and just another notification headache is thinner than you think, but a few core habits can make all the difference.
The biggest trap I see teams fall into is trying to monitor everything right out of the gate. On paper, it sounds comprehensive. In reality, it’s a fast track to alert fatigue. When your team is bombarded with notifications for every minor fluctuation, they eventually start tuning them all out—including the ones that actually matter.
Instead of trying to boil the ocean, start with what's most important.
Start Small and Focus on What Matters
First, sit down with your team and identify the absolute lifeblood metrics of your website or app. Ask yourselves: "If this number suddenly tanked, would it be an all-hands-on-deck emergency?" Those are your starting points.
Not sure where to begin? Here are a few reliable candidates:
- Core Conversion Metrics: Think user sign-ups, completed checkouts, or demo requests.
- Revenue Streams: For any e-commerce site, tracking sales data in real-time is a must.
- Critical Error Rates: A sudden jump in JavaScript errors or 500 server errors is a sure sign something is broken for your users.
- Key Performance Indicators: A nosedive in overall site traffic or a spike in page load times needs immediate investigation.
Stick to just three to five of these mission-critical metrics at first. This creates a high-signal, low-noise environment where every alert feels important. Once you’ve built a solid foundation and your team trusts the system, you can gradually start monitoring more.
Tune Alert Sensitivity to Your Business Rhythm
Your business has a natural pulse—daily, weekly, and seasonal patterns that are perfectly normal. A good anomaly detection system needs to learn that rhythm. What looks like an anomaly on a quiet weekday might be business as usual during a holiday sale.
For example, a 20% traffic spike on a random Tuesday morning could signal a bot attack. But that same spike on the day you launch a huge marketing campaign is exactly what you want to see. The system can't know the difference without your help.
The goal of a smart alerting system is not just to spot deviations, but to understand context. Regularly revisit your sensitivity settings after product launches, marketing campaigns, or holidays to teach the system what your 'new normal' looks like.
This is a continuous process. When you get a false positive, don't just sigh and close the notification. Treat it as a teaching moment. Go in, adjust the sensitivity, and give the model the context it needs to be smarter next time.
Combine Automation with Human Expertise
Automation is a workhorse—it never sleeps and can watch your data 24/7. But it’s missing a key ingredient: human intuition. The best monitoring strategies pair the relentless vigilance of machines with the deep-seated domain knowledge of your team.
Think of an alert not as a final verdict, but as the start of an investigation.
The machine flags the "what"—the revenue drop, the traffic spike. It’s your team’s job to figure out the "why." Is the payment gateway broken, or did a competitor just launch a massive sale? The machine points you in the right direction, but a human expert connects the dots to paint the full picture. This partnership is what turns raw data into smart, strategic decisions.
A Few Common Questions About Anomaly Detection
As you dip your toes into anomaly detection, a few questions always seem to pop up. Getting these sorted out early on will help you build a monitoring strategy that you can actually trust. Let's walk through some of the most common ones.
How Much Historical Data Do I Really Need to Get Started?
This is a classic "it depends" question, but I can give you some solid guideposts. The amount of data you need is tied to the rhythm of your business.
For basic statistical methods, you can often get a decent baseline with just a few weeks of data. That's usually enough to spot the normal ebb and flow of your daily and weekly traffic patterns.
But if you're aiming for something more sophisticated with machine learning, you'll need to feed the model more history. To catch monthly trends or true seasonality (like the holiday rush), you'll want at least 60-90 days of data. A full year is even better. The goal is to give the system a complete picture of what "normal" looks like, including all the predictable peaks and valleys.
What's the Difference Between an Outlier and an Anomaly?
People often use these words interchangeably, but in analytics, the distinction matters.
Think of an outlier as a single data point that's way off in left field. If your average page load time is two seconds, a single instance of a page taking 30 seconds to load is a textbook outlier. It’s a statistical loner.
An anomaly, on the other hand, is a broader idea. It’s a pattern that breaks from the norm. An anomaly might be caused by one dramatic outlier, sure, but it could also be a sudden jump in your baseline traffic, a cluster of weird events, or a shift in how two metrics usually relate to each other. We hunt for anomalies because they usually point to a bigger, more interesting story.
Can This Just Replace Me Staring at Dashboards All Day?
It’s tempting to think so, but it’s more accurate to see anomaly detection as a tireless assistant, not a full replacement. Its real power is its ability to watch your metrics 24/7, catching things a human would inevitably miss. It frees you from the drudgery of constant dashboard-checking.
Anomaly detection automates the vigilance, but it can't replace human context. The magic happens when you pair the speed of machines with the strategic insight of a person.
When an alert goes off, you still need a human to jump in, figure out the why, and decide what to do next. Automation is for detection; people are for interpretation and action.
What Do I Do About False Positives?
You're going to get false positives. It’s just part of the process, especially when you're just getting started. The trick is to think of your anomaly detection system as something you tune over time, not as a perfect oracle right out of the box.
Every time you get a false alert, treat it as a chance to make the system smarter. Ask yourself what happened:
- Was the sensitivity set too aggressively?
- Did that big marketing campaign we just launched cause a traffic spike that was actually good?
- Was this a weird one-off event that we can tell the system to ignore next time?
Good tools let you adjust sensitivity or even provide feedback, teaching the model that a certain event was okay. This continuous feedback loop is how you cut through the noise and build a system that delivers alerts you actually care about.
Ready to stop reacting to problems and start preventing them? Swetrix provides powerful, privacy-first anomaly detection to help you find and fix critical issues before they impact your users or your revenue. Start your 14-day free trial today and see what's really happening on your website.