- Date
Post Hoc Analysis Definition: Avoiding Pitfalls In Web Analytics
 Andrii Romasiun
A campaign finishes without a clear winner. You open the analytics dashboard, segment the traffic by device, and spot a conversion spike among German mobile users. Stop before you allocate budget to this hidden victory. Digging into analytics after a test concludes introduces mathematical risks and legal liabilities. Careless post hoc analysis drains marketing funds. Define testing parameters before launch to protect data integrity. Learn the post hoc analysis definition to avoid statistical illusions and spot trends without risk.
Understanding the Post Hoc Analysis Definition
The Meaning of Post Hoc
"Post hoc" translates from Latin to "after this." Analysts perform post hoc analysis when they examine a dataset after a campaign concludes to uncover unplanned patterns. Medical researchers invented the concept to track adverse effects missed during live clinical trials. Marketers adopted the practice to salvage failed A/B tests. You filter your traffic by age, location, or referral source until a positive number appears. Treat these discoveries as questions requiring new tests.
Marketers develop bad habits by relying on default platform settings. Dashboard interfaces feature dozens of clickable demographic filters. Every filter you apply after data collection ends counts as a post hoc exploration. Recognize this distinction to maintain honest reporting.
A Priori vs. Post Hoc Analysis
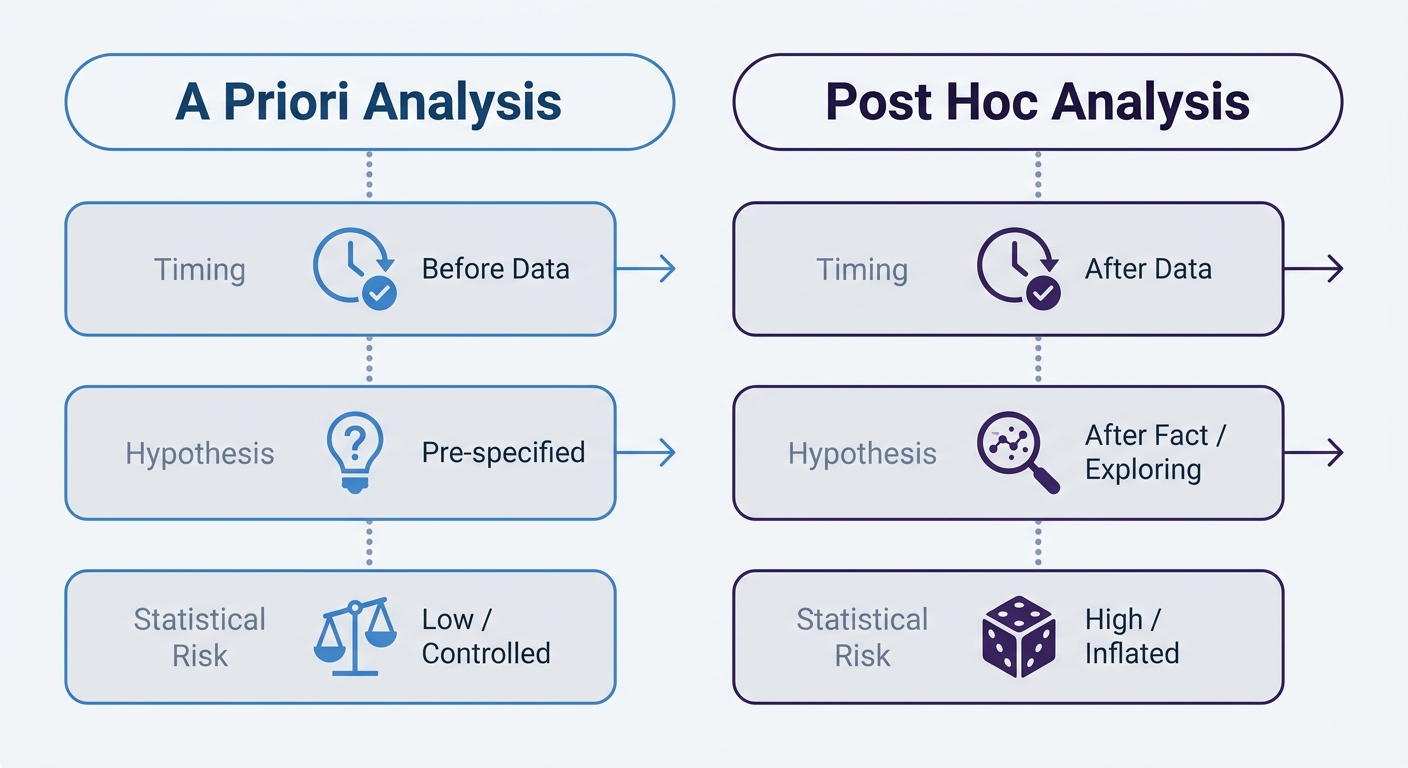
Contrast planned observation with unplanned exploration. A priori analysis tests a specific hypothesis you establish before data collection begins. A statement like "Changing the CTA button to red will increase conversions by 5 percent" serves as an a priori hypothesis. Run the test, measure the red button against the control, and accept or reject the premise.
Post hoc analysis ignores the initial hypothesis. The red button fails to increase overall conversions in your test. You segment the data by browser type and notice Safari users clicked the red button 12 percent more. Treat this observation as an exploratory finding to test in a future campaign.
| Feature | A Priori Analysis | Post Hoc Analysis |
|---|---|---|
| Timing | Defined before data collection | Conducted after data collection |
| Hypothesis | Tests a specific stated theory | Searches for unstated patterns |
| Statistical Risk | Low risk of false positives | High risk of false positives |
| Business Use | Making final business decisions | Generating new testing ideas |
Build new ideas from post hoc analysis to fuel your next a priori tests. Mixing these distinct approaches creates false confidence in random anomalies.
The Statistical Risks in Digital Marketing
The Multiple Comparisons Problem
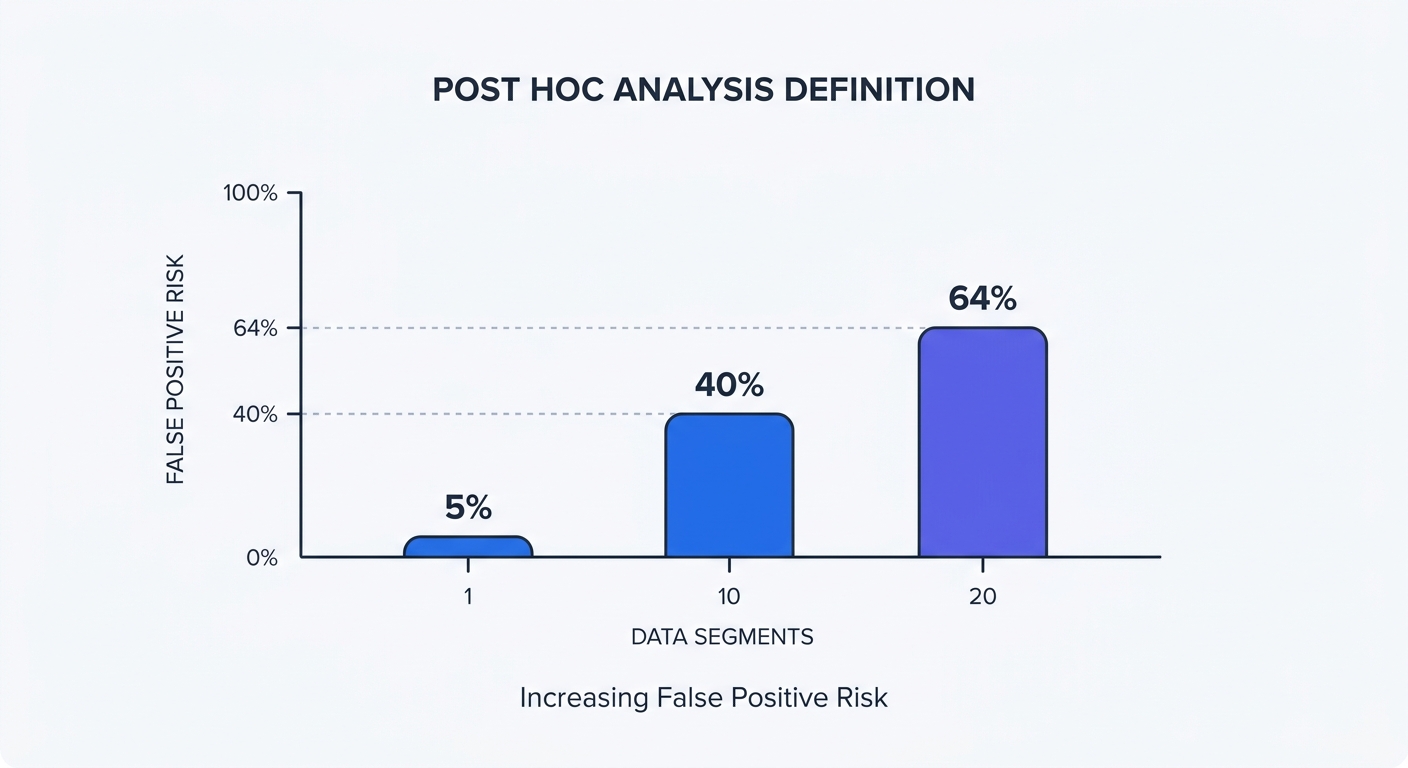
Statistical tests contain a built-in error rate. Standard e-commerce and SaaS A/B tests require a 5 percent significance level, though accepted thresholds can range from 1 to 10 percent depending on industry risk tolerance. You accept a 1-in-20 chance that a winning result is a random fluke. Test one primary metric to keep the risk at 5 percent. Testing multiple segments afterward compounds the error rate. Statisticians call this phenomenon the multiple comparisons problem.
Slice a failed A/B test into 10 independent demographic segments. Calculate the probability of encountering a false positive using the formula $1 - (1 - 0.05)^{10}$, which equals 40 percent. Break the same data into 20 segments, such as device type, location, and traffic source. The risk of encountering false positives balloons to 64 percent.
Stop trusting raw dashboard metrics without context. A 64 percent chance of a false positive turns data analysis into a coin flip. Making decisions based on these segmented numbers wastes thousands of dollars optimizing for phantom audiences.
The Marketer’s P-Hacking Trap
Data dredging happens when analysts manipulate a dataset to force a positive result. Account managers seeking to impress clients might ignore a campaign that generated zero overall lift. Analysts apply filter after filter until a correlation appears, presenting a minor Safari conversion spike as a definitive win.
Stop presenting post hoc segments as primary results. Searching for any pattern in a large dataset produces random anomalies that appear statistically significant. Marketers might mistake a sudden spike in organic search traffic among desktop users in Berlin for a brilliant campaign response. This metric usually represents statistical noise.
Guard your analytics process against p-hacking. Document success metrics before spending ad dollars. Restrict unplanned segmentation to internal strategy meetings. Require a dedicated validation test before spending budget to scale a post hoc discovery.
GDPR and Privacy Challenges in Retrospective Analysis
Strict Purpose Limitation
European regulators dictate how companies handle historical user data through privacy laws. Regulators enforce a standard called Purpose Limitation under Article 5 of the General Data Protection Regulation (GDPR). Collect data for one explicit purpose and avoid processing that information later for unconsented reasons.
Companies violate this rule during retrospective analysis. A brand asks users for consent to track cart abandonment. The marketing team runs a post hoc analysis on that stored data six months later to build personalized ad retargeting profiles. This secondary processing requires fresh consent. Regulators issue severe fines for these fishing expeditions. Review your cookie consent setup to ensure stated tracking purposes match actual analysis habits.
Delete stored user tracking data once the original campaign ends. Holding granular demographic profiles creates legal liability. Extract specific, planned insights during the campaign rather than hoarding data for future exploration.
The Decline of True Anonymization
Marketers often claim historical data remains anonymous. Legal scholars and data scientists disagree with this assessment. Complete anonymization of granular user journeys proves impossible in modern tracking. Stripping names and emails from a database still leaves location, device type, click timestamps, and referral sources intact. This specific combination of metadata creates a unique fingerprint.
Storing databases of individualized tracking points invites compliance disasters. Protect your business by abandoning the practice of saving granular user sessions for future mining. Focus your analytics on macro-level trends.
Build reports around aggregate behavior. Track the total volume of signups from a specific region to evaluate geographic performance. Analyzing aggregate data protects companies from GDPR scrutiny while removing the temptation to profile individual visitors post hoc.
Best Practices for Safe Data Exploration
Statistical Correction Methods
Analysts use statistical correction formulas to defend against false positives. Apply these calculations when analyzing multiple segments after a test ends to raise the significance threshold.
Select a statistical correction method to maintain data integrity:
- Bonferroni Correction: Divide the standard significance level (0.05) by the number of segments checked. Checking 10 different traffic sources drops the target threshold to 0.005. A segment must beat this stricter benchmark to warrant further testing.
- Benjamini-Hochberg Procedure: This method controls the False Discovery Rate (FDR) while maintaining more flexibility than the Bonferroni method. Marketing teams use A/B testing calculators featuring this formula to prevent flawed decisions.
- Tukey's HSD: Apply this Honest Significant Difference test after an Analysis of Variance (ANOVA). It identifies which specific variations in a multi-variate test caused the performance gap.
Implement these formulas in your spreadsheet before presenting findings to stakeholders. Add a column in your reporting template for the Bonferroni adjusted p-value. Require your team to review the corrected math before declaring a sub-segment the winner.
Pre-Registration and The Test-and-Verify Rule
Document your experiment parameters in a central wiki before launch. Limiting the initial scope prevents analysts from shifting the goalposts later.
Execute these steps to pre-register your analysis:
- List the primary Key Performance Indicator (KPI).
- Name a maximum of two secondary KPIs.
- Define the required sample size using a traffic calculator.
- Commit to a hard end date for data collection.
Place any observation outside this document into the exploratory category. Label these anomalies as "Hypotheses for Future Testing" in the final report.
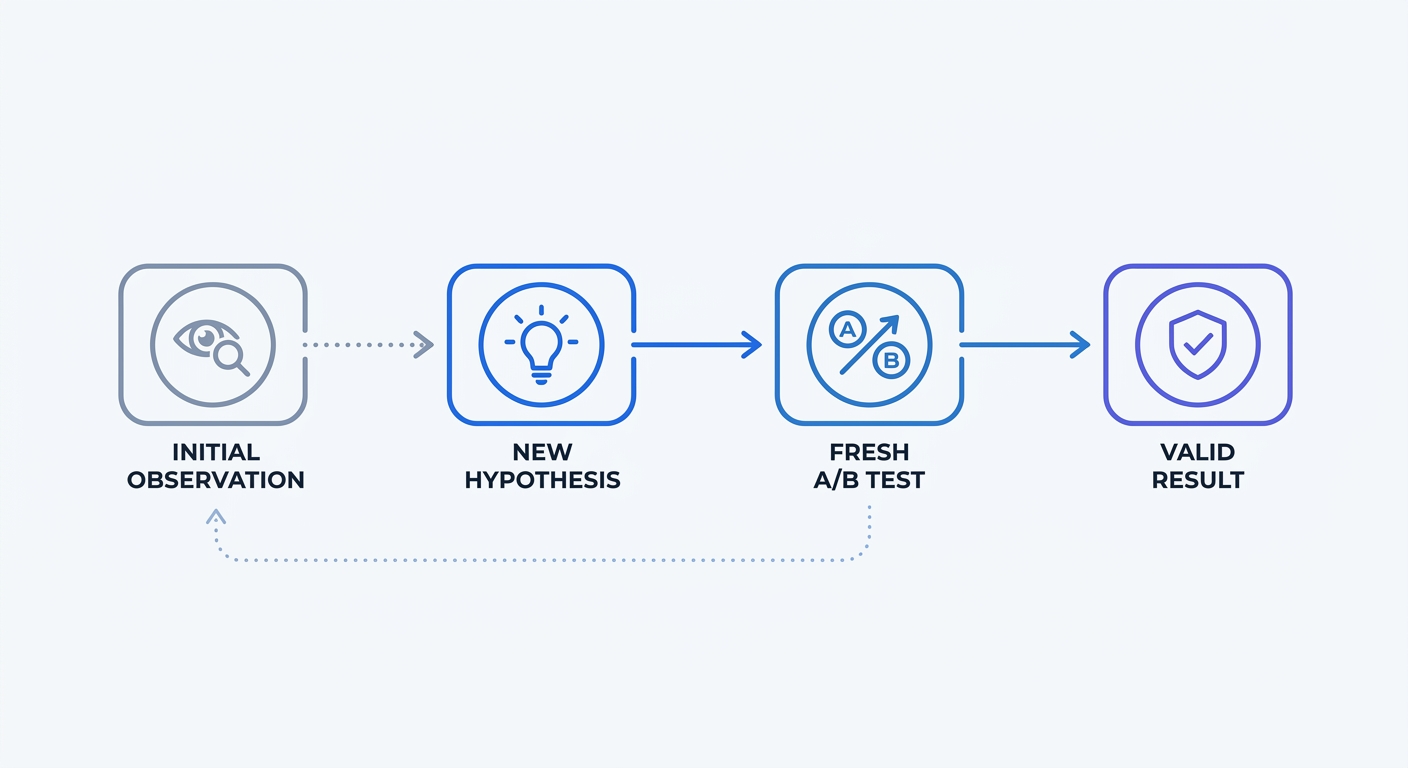
Apply the Test and Verify rule for all exploratory findings. Imagine a post hoc review reveals a specific landing page layout performing well for tablet users. Formulate a new hypothesis instead of rewriting the website code. State a specific goal, such as predicting a 10 percent conversion increase for the new tablet layout. Launch a fresh a priori A/B test targeted at tablet users to validate the theory.
Cookieless Analytics: The Privacy-First Solution
Aggregated Data vs. Individual Tracking
Abandon individual user profiles. Analyzing aggregated traffic eliminates the multiple comparisons problem and prevents GDPR compliance headaches.
Individual tracking relies on invasive cookies to follow specific users across the web. This method generates noisy datasets prone to manipulation while exposing companies to regulatory audits. Aggregated analytics bundle traffic data into high-level metrics. Teams review total pageviews, average bounce rates, and broad geographic trends.
Analyzing aggregate data protects user privacy by design. Teams bypass strict GDPR purpose limitation clauses by using datasets containing zero Personal Identifiable Information (PII). Examining broad behavioral shifts becomes safe and compliant. Build better client reports using an SEO dashboard that prioritizes macro-level insights over intrusive user tracking.
Structure your aggregated data using UTM parameters. Tagging links before launch guarantees clean data collection to prevent forced post hoc analysis. Append source, medium, and campaign tags to every URL. The analytics platform parses these tags on page load to file each visit under the correct campaign.
Retrospective Analysis with Swetrix
Safe post hoc analysis requires the proper software foundation. Swetrix delivers a cookie-free, open-source web analytics platform built for strict privacy compliance. Track website performance without harvesting individual visitor identities.
Monitor overall campaign success via a clean dashboard. Formulate new hypotheses based on real-time traffic spikes and referring domain volume. Spotting a sudden influx of visitors from a new social platform creates a prime testing opportunity. Launch a dedicated landing page for that specific traffic source to measure the precise conversion rate.
Retrospective trend spotting becomes a low-risk activity when the underlying data remains anonymous and aggregated. Escaping the legal pitfalls of legacy analytics platforms requires proactive choices. Keep data collection clean, fast, and compliant to ensure sustainable growth.
Stop risking marketing budgets on statistical noise. Try Swetrix for free today to access privacy-first, cookieless analytics that protect data integrity.