- Date
Mastering Reporting Digital Marketing
 Andrii Romasiun
Digital marketing reporting is how you turn a mountain of raw data from your campaigns into a clear story about what’s actually happening. It’s not about just pulling numbers; it's about finding the insights that show what's working, what's a waste of money, and where you should put your budget next. This whole process stops marketing from being a guessing game and turns it into a reliable engine for growing the business.
We're going to break down how to build a reporting system that gives you clarity, inspires confidence, and proves your marketing is a real asset. First, let's look at the core pillars of any strong reporting strategy.
Core Components of Effective Digital Marketing Reporting
| Pillar | Description | Key Outcome |
|---|---|---|
| KPI Selection | Choosing the right metrics that align directly with business goals for each marketing channel. | Focus on what truly matters, avoiding vanity metrics. |
| Report Design | Structuring reports and dashboards to be easily understood by different stakeholders. | Clear, actionable insights instead of data overload. |
| Cadence & Stakeholders | Establishing a rhythm for reporting (daily, weekly, monthly) tailored to the right audience. | Relevant information delivered to the right people at the right time. |
| Automation & Alerts | Setting up systems to automatically gather data and flag significant changes in performance. | Saved time and rapid response to opportunities or problems. |
| Privacy-First Analytics | Adopting tools and methods that respect user privacy while still gathering crucial data. | Trustworthy data collection that complies with regulations like GDPR. |
These five pillars form the foundation of a reporting system that doesn't just track activity but measures real impact. Let's dive deeper into why this is so critical.
Why Digital Marketing Reporting Is Your Strategic Compass
Imagine a ship captain trying to cross the ocean without a compass, a map, or a single weather forecast. They might have a great ship and a skilled crew, but their journey is completely up to chance. They're just hoping to land somewhere valuable. That’s exactly what it feels like to run marketing campaigns without solid reporting—a series of expensive guesses with no real direction.
Think of your reporting as that strategic compass. It takes overwhelming spreadsheets and disconnected metrics and weaves them into a story you can actually understand. This is absolutely essential for finding your way through modern marketing, where every click, view, and conversion is a clue waiting to tell you something important.
From Data Overload to Actionable Insights
The whole point of a report isn't just to show off data; it's to trigger smart decisions. We're in an era where global ad spending has shot past $1 trillion, and with digital channels eating up over 75% of that pie, every single dollar has to pull its weight.
A well-built reporting system helps you do a few key things:
- Prove Your Value: Show stakeholders exactly how your marketing efforts are adding to the bottom line and hitting business goals.
- Optimize Your Strategy: Pinpoint which channels are knocking it out of the park and which campaigns are falling flat, so you can move your budget where it will do the most good.
- Spot New Opportunities: Uncover hidden trends in customer behavior or shifts in the market that could inspire your next big campaign.
A great report doesn't just spit out numbers—it turns marketing data into a story about progress, results, and opportunities. It’s the bridge between your team's hard work and the client's business goals.
The Foundation of Growth
At the end of the day, reporting is the foundation you build a successful marketing machine on. It’s the feedback loop you need to learn, adapt, and consistently get better results.
By getting a handle on the basics of web analytics and reporting, you can stop tracking simple activity and start measuring your true impact. To get up to speed, check out our guide on what is web analytics to build a stronger foundation.
Choosing KPIs That Actually Drive Business Growth
Ever feel like you're drowning in data but starving for actual insights? It’s a classic marketing problem. The solution isn't about tracking more metrics; it's about tracking the right ones—the Key Performance Indicators (KPIs) that connect directly to your business goals.
Too many marketers get caught up chasing vanity metrics. These are the numbers that feel good but don't mean much for the bottom line: social media likes, page views, email opens. They're easy to count and look great on a chart, but they rarely tell you if your marketing is actually making a difference.
Real progress comes from measuring outcomes, not just activity. It's about shifting your focus from what's easy to count to what truly signals growth.
From Vanity Metrics to Impactful KPIs
To make that shift, you need to tie every metric you track back to a specific business objective. Think of it as a clear chain of events: your marketing action leads to a measurable result. Your reports should tell that story, plain and simple.
Here’s how that looks in practice:
Instead of: Celebrating a huge spike in organic traffic from SEO.
Focus on: The conversion rate from that organic traffic. How many of those visitors actually signed up for a trial, bought a product, or filled out your contact form?
Instead of: Bragging about a high click-through rate (CTR) on your PPC ads.
Focus on: The actual Return On Ad Spend (ROAS). For every dollar you put in, how many dollars in revenue are you getting back?
This approach turns your reports from a list of disconnected numbers into a powerful tool for making smart decisions. The goal is to climb the ladder from raw data to actionable insights that move the needle.
This diagram shows how smart reporting can turn data into strategic action, which is really the heart of any data-driven marketing effort.
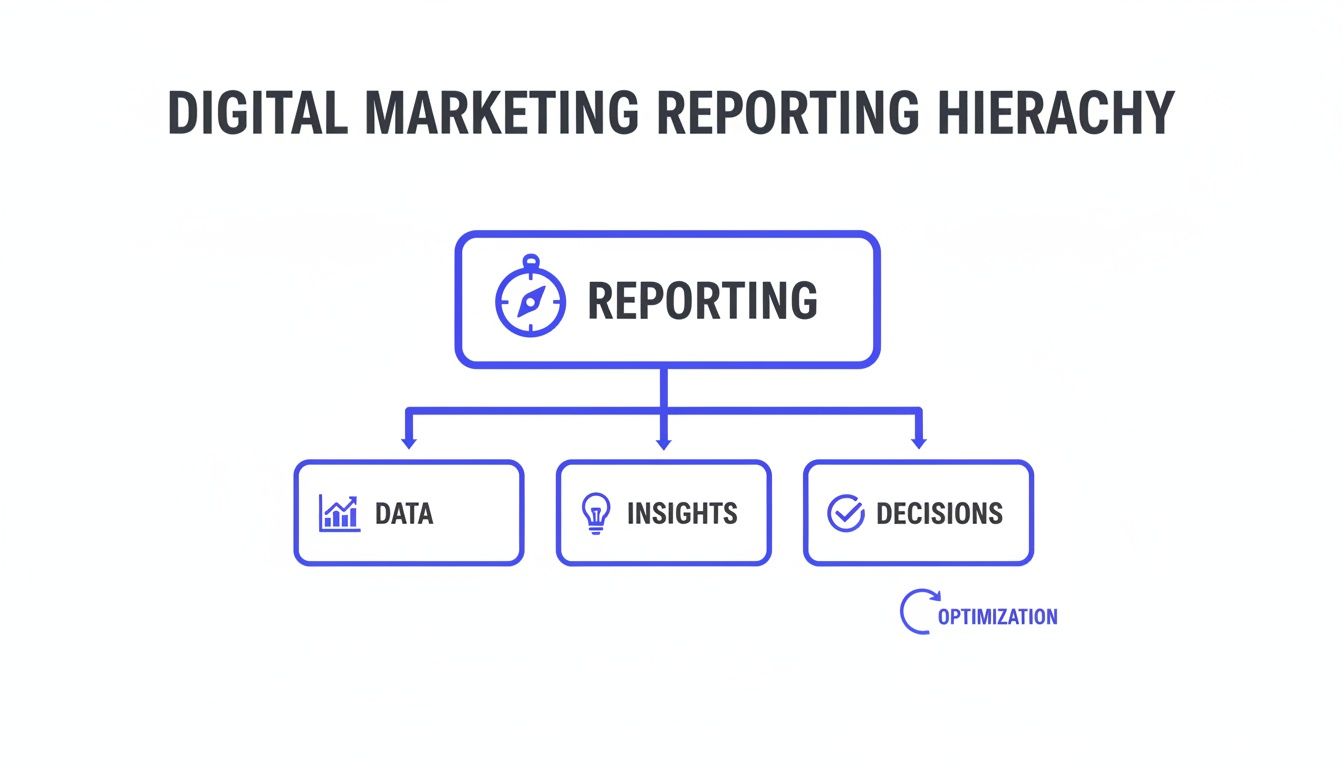
As you can see, data is just the foundation. The real value is unlocked when you can pull insights from it to guide your next move.
Selecting KPIs for Core Marketing Channels
Different channels have different jobs, so a one-size-fits-all approach to KPIs just won't cut it. You have to tailor your measurement strategy to what each channel is designed to do.
Here’s a breakdown of the KPIs that really matter for the big digital marketing channels.
Search Engine Optimization (SEO)
SEO is a long game focused on building visibility and authority. Your KPIs should reflect that.
- Organic Conversions: The number of leads or sales coming directly from organic search. This is the ultimate proof that your SEO is working.
- Keyword Rankings (for commercial terms): Don't just track any keyword. Focus on your rank for terms that signal high purchase intent.
- Organic-Driven Revenue: For any e-commerce site, this is non-negotiable. It's the total revenue you can directly attribute to organic search.
Pay-Per-Click (PPC) Advertising
PPC is all about getting immediate, targeted action and making sure your ad spend pays for itself.
- Cost Per Acquisition (CPA): Simply put, how much does it cost you to get one new customer through your ads?
- Return On Ad Spend (ROAS): This is the holy grail of PPC metrics. It measures the total revenue you earn for every dollar you spend on ads.
- Conversion Rate: What percentage of people who click your ad end up taking the action you want them to?
The push for measurable returns is why digital advertising has absolutely exploded, more than doubling since 2019. Projections show it will make up 75.2% of global ad spending by 2025, hitting around $777 billion—a milestone we reached two years ahead of schedule. Why? Because the ROI is so clear and measurable. You can discover more about these global advertising trends and what they mean for marketers.
Email Marketing
Email is fantastic for nurturing relationships and keeping customers coming back.
- List Growth Rate: How quickly is your email list growing? A healthy growth rate means your top-of-funnel is working.
- Click-to-Open Rate (CTOR): Of the people who opened your email, what percentage clicked a link? This tells you how engaging your content really is.
- Email-Attributed Revenue: Tracking the direct sales that came from a click in one of your email campaigns.
Picking the right KPIs all comes down to asking the right questions. Instead of asking, "How many people saw our ad?" you should be asking, "Of the people who saw our ad, how many did what we wanted them to do?"
When you adopt this mindset, your reporting digital marketing efforts will transform. You’ll move from just collecting data to building a strategic tool that guides your team, proves your value, and consistently helps the business grow.
Designing Dashboards That Inspire Action, Not Confusion
A great digital marketing report should do more than just spit out numbers; it needs to tell a story that makes people want to take action. Far too often, reports end up as a data dump—a messy collection of charts and metrics that just leaves stakeholders confused. The goal is to turn that raw data into a clean, intuitive dashboard that actually helps people make smart decisions.
Think of a bad dashboard as a junk drawer. You know the important stuff is in there somewhere, but it's buried under a mountain of clutter. A great dashboard, on the other hand, is like a perfectly organized toolbox. Every tool is in its place, clearly labeled, and ready to go. You can grab what you need and get to work.
The secret is all in how you present the data. Good data visualization isn't just about making things look pretty. It’s about picking the right visual to tell your story so clearly that anyone can understand it in a glance.
Choosing the Right Visualization for Your Marketing Data
The type of chart you pick has a massive impact on how your data is perceived. Each visualization is built for a specific job. If you choose the wrong one, you can accidentally hide your most important findings. But when you get it right, your insights practically jump off the page.
Here’s a practical guide to help you match the right visual to your data, ensuring your story is always crystal clear.
Choosing the Right Visualization for Your Marketing Data
| Data Type / Goal | Best Visualization Type | Example Use Case |
|---|---|---|
| Tracking a metric over time | Line Chart | Showing the month-over-month growth of organic website traffic. |
| Comparing values across categories | Bar Chart (Vertical or Horizontal) | Comparing the number of leads generated by different marketing channels (e.g., SEO, PPC, Social Media). |
| Showing parts of a whole | Pie Chart or Donut Chart | Breaking down the percentage of website visitors by device type (desktop, mobile, tablet). Use sparingly for 2-4 categories max. |
| Displaying progress toward a goal | Gauge or Progress Bar | Visualizing how close you are to hitting your quarterly sales target. |
| Illustrating geographical data | Map Chart | Showing which countries or regions are driving the most conversions. |
By mastering these basic pairings, you can make sure your audience gets the main point in seconds, without you having to spell it out.
Principles of Effective Dashboard Design
Once you know which charts to use, the next step is putting them together into a dashboard that makes sense. A well-designed dashboard guides the viewer's eye, provides crucial context, and weaves individual metrics into a cohesive story.
Here are a few principles I always stick to:
Create a Clear Visual Hierarchy: Put your most critical, big-picture KPIs—like total revenue or new leads—at the top left. This is where the eye naturally lands first. Then, arrange the supporting details and channel-specific data below or to the right.
Add Context and Annotations: A number on its own is meaningless. Is 500 new leads good? Well, it's fantastic if your goal was 400, but not so great if you were aiming for 1,000. Use annotations directly on your charts to explain sudden spikes or dips, like "New blog post published" or "Major algorithm update."
Keep It Simple and Uncluttered: Fight the urge to cram every possible metric onto one screen. White space is your friend—use it to separate different sections and charts. A clean, organized layout helps people focus and prevents them from feeling overwhelmed.
A dashboard should answer more questions than it creates. If a stakeholder looks at your report and their first reaction is "What am I even looking at?" you've lost them before you've even started.
Following these rules is the difference between a dashboard that gets a quick glance and one that gets bookmarked and used every day. For a deeper look at building powerful layouts, check out our guide on creating an effective web analytics dashboard.
Good Dashboard vs. Bad Dashboard: An Example
Let's say you're reporting on website performance.
A bad dashboard might have 15 different widgets thrown together without any rhyme or reason. You'll see total visitors next to server response time, and bounce rate next to social media followers. It’s a chaotic mess of clashing colors and three different kinds of pie charts, making it impossible to see what actually matters.
A good dashboard, however, tells a story. It starts with the bottom line: Total Conversions and Conversion Rate. Right below that, a simple bar chart breaks down traffic sources. Next to it, a line chart shows conversion trends over the past six months. It’s clean, logical, and instantly communicates performance.
In the end, designing a great dashboard is about empathy. You have to step into your audience's shoes and build a reporting digital marketing tool that gives them the answers they need, quickly and clearly.
How to Talk About Data With Your Stakeholders
The most beautifully designed dashboard is worthless if you can't explain what the data actually means. Great reporting digital marketing is as much about people as it is about numbers. It’s about telling a clear story that connects with your audience, whether you're talking to a time-crunched CEO or an in-the-weeds campaign manager.
Think of yourself as a translator. A data point like "CTR increased by 15%" is just marketing jargon to an executive. But when you frame it in the language of business—"Our new ad creative is really resonating with people, and that drove a big jump in qualified leads"—you tie your team's work directly to the things they actually care about. The goal is to shift the conversation from activity to impact.
Tailoring the Narrative for Different Audiences
Not everyone needs to see every single metric. In fact, showing the wrong data to the right person is one of the fastest ways to lose their attention. You have to customize your reporting to fit the stakeholder's role and what's on their mind.
Here’s a simple way to think about it:
- For the C-Suite (CEO, CFO): They live at the 30,000-foot view. Stick to the big picture, bottom-line numbers in a monthly or quarterly report. They just want to know if their investment is paying off.
- Key Questions: Is marketing bringing in revenue? What does it cost us to get a new customer (CAC)? Are we gaining ground on our competitors?
- For Marketing Leadership (CMO, Director): They need to see how channels are performing to make smart decisions about budget and resources. A weekly or bi-weekly summary usually hits the sweet spot.
- Key Questions: Which channels are giving us the most bang for our buck? Are we getting good quality leads? Is our brand getting more visible over time?
- For Channel Managers (PPC, SEO, Social): These are the folks on the front lines. They need granular, often daily or weekly, data to tweak campaigns and fix problems as they happen.
- Key Questions: Which version of the ad copy is converting best? Are we moving up or down for our most important keywords? How did yesterday's social media post perform?
The golden rule of stakeholder reporting is simple: give them the insight they need to make their next decision, and nothing more. Your job is to cut through the noise and deliver clarity, not just a data dump.
From Data Points to Actionable Recommendations
One of the biggest mistakes people make in reporting meetings is just reading numbers off a slide. That’s a passive approach that forces your audience to do the heavy lifting of figuring out what it all means. A truly powerful report turns observations into clear, actionable next steps.
Try framing your updates around this simple three-part story:
- What We Saw (The Data): "Our organic traffic from the new blog series jumped by 40% this month."
- What It Means (The Insight): "This tells us there’s a real appetite for content that helps customers solve [specific problem]."
- What We Should Do Next (The Recommendation): "Because of this, I think we should double down by creating two more articles on this topic and put a small ad budget behind them to bring in leads even faster."
Following this structure changes your role from a simple data reporter to a strategic partner. You're no longer just presenting facts; you're guiding the business toward smarter, evidence-backed decisions. This is what reporting digital marketing is all about—using data not just to look back at what happened, but to confidently map out the road ahead.
Automating Your Reporting and Embracing Privacy
Let's be honest, modern marketing reporting shouldn't mean drowning in spreadsheets every week. The goal is to build an intelligent, automated system that does the heavy lifting for you, freeing you up to think strategically. Think of automation tools as your tireless data assistants, constantly pulling information from all your channels into one unified, always-current dashboard.
This completely eliminates the soul-crushing, error-prone task of manual data entry. No more logging into five different platforms every Monday morning just to cobble together a single report. Instead, your most important metrics are always right there, giving you back precious hours to actually analyze what's happening, spot opportunities, and plan your next big move.
The Power of Automation
Automating your reporting does more than just save a few hours; it fundamentally changes how you work. When you set up automated alerts, you get instant notifications about significant changes—like a sudden nosedive in organic traffic or an unexpected spike in your ad costs.
This allows you to be proactive, tackling issues before they snowball into major problems. It shifts your role from being a reactive data-gatherer to a forward-thinking strategist who can make quick, data-backed decisions to protect your budget and performance.
The Critical Shift to Privacy-First Analytics
While you're streamlining your data collection, another massive shift is happening across the industry: the move to privacy-first analytics. With regulations like GDPR now the norm and the slow death of third-party cookies, the old ways of tracking users are quickly becoming obsolete. People are demanding more control over their data, and businesses that don't adapt will lose trust.
This isn't just a box-ticking exercise for compliance; it's about building a sustainable and ethical marketing strategy. Relying on invasive tracking methods is a dead-end street. To future-proof your analytics, you need to choose tools that respect user privacy without sacrificing the insights you need. This is where privacy-focused platforms become absolutely essential for accurately reporting digital marketing results.
In this new era of marketing, trust is the ultimate currency. A privacy-first approach isn't a limitation—it's a competitive advantage that shows customers you value their privacy as much as their business.
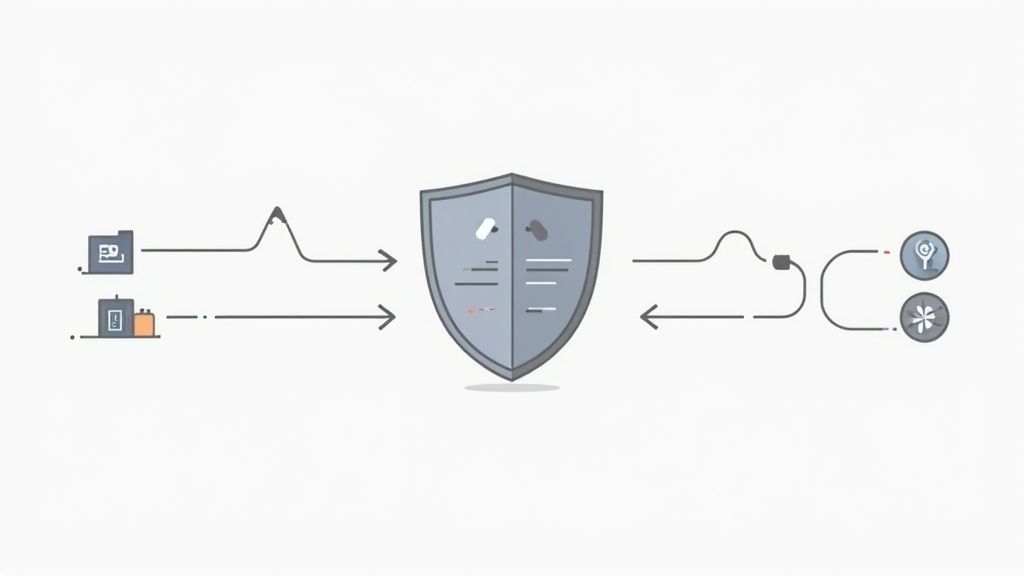
The image above gives a great visual of how privacy-compliant tools act as a protective shield, making sure data is handled securely and ethically. This model is vital for keeping both user trust and data integrity in today's regulated world.
A Practical Solution for Modern Reporting
This is exactly why platforms like Swetrix exist. They are built from the ground up for this new reality, giving you the core metrics you need—like traffic sources, user flows, and conversion events—without ever using cookies or collecting personal data. This approach guarantees you get accurate, useful insights while staying 100% GDPR-compliant. If you're new to the concept, learning more about privacy-friendly analytics can really open your eyes to how it can benefit your strategy.
The digital ad space isn't slowing down. Video ad spending is on track to hit $207.5 billion by 2025, and social media ads now account for over 30% of all digital ad spending. With investments this big, having a reliable and ethical analytics foundation is non-negotiable for proving ROI. By embracing both automation and privacy-first tools, you're setting your marketing efforts up for real, sustainable success.
Turning Your Data Into a Competitive Advantage
We've covered a lot of ground in this guide, walking through everything you need to turn digital marketing reporting from a chore into your secret weapon. The real goal here isn't just to gather data—it's to make smarter decisions that give you a serious edge over the competition.
We started with the fundamentals, like picking the right KPIs, then moved on to designing dashboards that actually tell a story and get people to act. When you put these pieces together, you're not just launching campaigns into the void. You're building a well-oiled marketing machine that learns, adapts, and proves its value every single day.
From Cost Center to Growth Engine
Ultimately, great reporting changes how the rest of the company sees the marketing team. You stop being a line item on a budget and start being seen as a reliable, predictable source of business growth. Every report you deliver is another proof point, cementing marketing's role as a true revenue driver.
This shift doesn't happen by accident. It’s built on a few key ideas:
- Clarity over Complexity: Your reports need to answer questions instantly, not raise new ones.
- Action over Observation: Every chart and number should point to a clear next step or a decision that needs to be made.
- Impact over Activity: Forget vanity metrics. Focus on the numbers that directly connect to revenue and new customers.
Getting your reporting right is a journey, not a destination. But the payoff isn't just a better-looking dashboard. It's a marketing team that commands respect, secures more budget, and delivers results that matter.
The final takeaway is simple: just start. You don't have to overhaul everything overnight. Pick one dashboard to improve this week. Find one stakeholder meeting to make more impactful next month. Every small, deliberate step gets you closer to building a winning, data-driven culture.
Frequently Asked Questions About Marketing Reporting
Even with the best dashboards in the world, a few questions always seem to surface. Let’s clear up some of the most common points of confusion that come up when building a solid digital marketing reporting strategy.
Getting these details right is what separates a report that gets glanced at from one that actually drives decisions.
What Is The Real Difference Between Reporting And Analytics?
People throw these terms around interchangeably all the time, but they’re not the same thing. They’re two sides of the same coin, and knowing the difference is crucial.
Think of it like a sports game. Reporting is the scoreboard—it tells you who won and by how much. Analytics is the post-game analysis from the commentators, explaining why they won and what the losing team needs to fix.
- Reporting shows you what happened. It’s the straightforward process of gathering data and putting it into a readable format. For example: "We generated 1,000 new leads last month." It’s a fact. It’s what happened.
- Analytics tells you why it happened and what you should do about it. This is where you dig into the data from your reports to find the story. An analytical insight would be: "The vast majority of those 1,000 leads came from our new blog post on data security. We should clearly invest more in that content topic."
How Often Should I Send Out Marketing Reports?
This is a classic "it depends" scenario. There’s no magic number here. The right frequency comes down to who’s reading the report and what they need to do with the information. Sending a daily report to your CEO is just as useless as sending a quarterly report to a campaign manager.
A simple way to think about it is to match the cadence to the role:
- Campaign Managers: They need data daily or weekly. These are the folks in the trenches, tweaking ad copy, adjusting bids, and fine-tuning targeting. They live and breathe real-time data to make quick optimizations.
- Marketing Leadership: A weekly summary is usually the sweet spot. Marketing directors and VPs need to keep a finger on the pulse of overall performance to manage budgets and shift resources, but they don't need to get bogged down in daily fluctuations.
- The C-Suite: Think monthly or quarterly. Executives are looking at the 10,000-foot view. Their main concerns are high-level ROI and how marketing is impacting major business goals, not the nitty-gritty of individual campaigns.
What Are The Best Tools For Automated Dashboards?
There are plenty of fantastic tools out there to pull your data into beautiful, automated dashboards. You’ve probably heard of the big ones: Looker Studio (what used to be Google Data Studio), Tableau, and Power BI. They're all powerful and can connect to just about any data source you can imagine.
But here’s the thing—a fancy dashboard is completely worthless if the data flowing into it is garbage. The tool you use for visualization is secondary to the quality of your actual analytics platform.
This is why the tool that collects the data in the first place—whether it's Google Analytics or a privacy-first alternative like Swetrix—is the most important part of your entire reporting stack. You can't build a strong house on a shaky foundation, and you can't build a useful report on bad data.
Ready to build your reporting on a foundation of clean, privacy-compliant data? Swetrix provides the actionable insights you need without compromising user trust. Start your 14-day free trial today.