- Date
How to Measure Marketing Campaign Effectiveness That Drives Growth
 Andrii Romasiun
If you can't measure it, you can't improve it. This old saying is the absolute bedrock of successful marketing. But effective measurement isn't about drowning in data; it's about starting with a clear business goal and then picking the handful of metrics—the Key Performance Indicators (KPIs)—that tell you if you're actually getting closer to it.
This is the foundation. Without it, you’re just collecting numbers without a story.
Laying the Groundwork for Measurement
Before you even think about launching a campaign, you need a blueprint for what success looks like. I've seen too many teams jump straight into tactics, only to realize later they have a mountain of data that doesn't answer the most important question: "Did this actually work?"
A solid measurement plan isn't about tracking every single click or impression. It’s about being deliberate. It’s about deciding what you need to know and then building a system to find those answers. This is how you turn marketing from a perceived cost center into a predictable engine for growth.
The most common mistake? Starting with a vague goal like "increase brand awareness" or "drive more traffic." These sound good in a meeting, but they're impossible to measure meaningfully. How much awareness? What kind of traffic? You have to tie every marketing action back to a tangible business outcome.
From Murky Goals to Crystal-Clear Objectives
The real first step is to translate what the business needs into a specific, measurable marketing objective. This means cutting through the marketing jargon and focusing on the financial or operational impact you want to make.
Let's say you're a B2B software company and the big-picture goal is to grow enterprise revenue. A weak marketing objective would be "get more leads." A truly powerful, measurable objective sounds more like this: "Generate 250 marketing-qualified leads (MQLs) from our target enterprise segment with a cost per MQL under $150, all within Q3."
See the difference? This objective gives everyone perfect clarity:
- Specific: It’s not just leads; it’s "marketing-qualified leads" from the "enterprise segment."
- Measurable: The target is a hard number: 250 MQLs.
- Achievable: It's a stretch, but based on past performance, it's not a fantasy.
- Relevant: This directly fuels the company's primary goal of boosting enterprise revenue.
- Time-bound: There's a clear deadline: the end of Q3.
Going through this exercise forces you to think critically about what you're really trying to accomplish before a single dollar is spent.
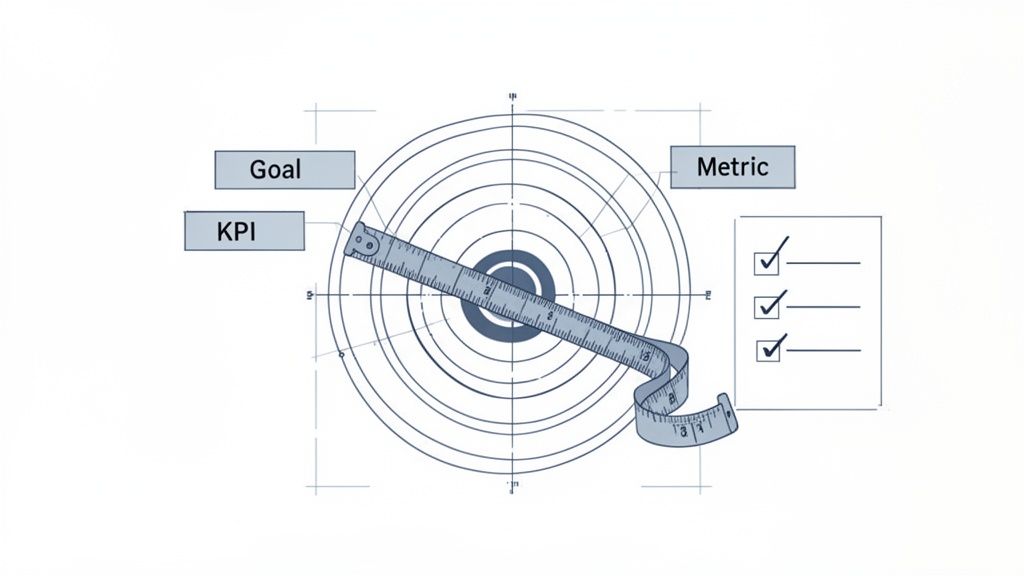
Choosing KPIs That Actually Matter
With a clear objective locked in, you can now select the KPIs that will act as your campaign's vital signs. These are the specific metrics you’ll watch to know if you're on track. The trick is to separate the genuinely useful KPIs from the vanity metrics.
A vanity metric, like social media likes, feels good but doesn't tell you much about business impact. An actionable KPI, like Customer Acquisition Cost (CAC), tells you exactly how efficiently your campaign is generating real value.
The right KPIs depend entirely on your objective. A campaign designed to build brand awareness looks very different from one built to drive immediate sales.
For a Brand Awareness Campaign, you might track:
- Share of Voice (SOV): How often your brand gets mentioned versus your competitors.
- Direct Website Traffic: More people typing your URL directly into their browser is a great sign.
- Branded Search Volume: An uptick in people searching for your brand name on Google.
For a Direct-Response Campaign, your focus would be on:
- Conversion Rate: The percentage of people who take the desired action (buy, sign up, etc.).
- Cost Per Acquisition (CPA): How much it costs, on average, to get one new customer.
- Return on Ad Spend (ROAS): The raw revenue generated for every dollar you put into ads.
This simple planning process shows how clear objectives naturally lead you to the right KPIs for your measurement plan.
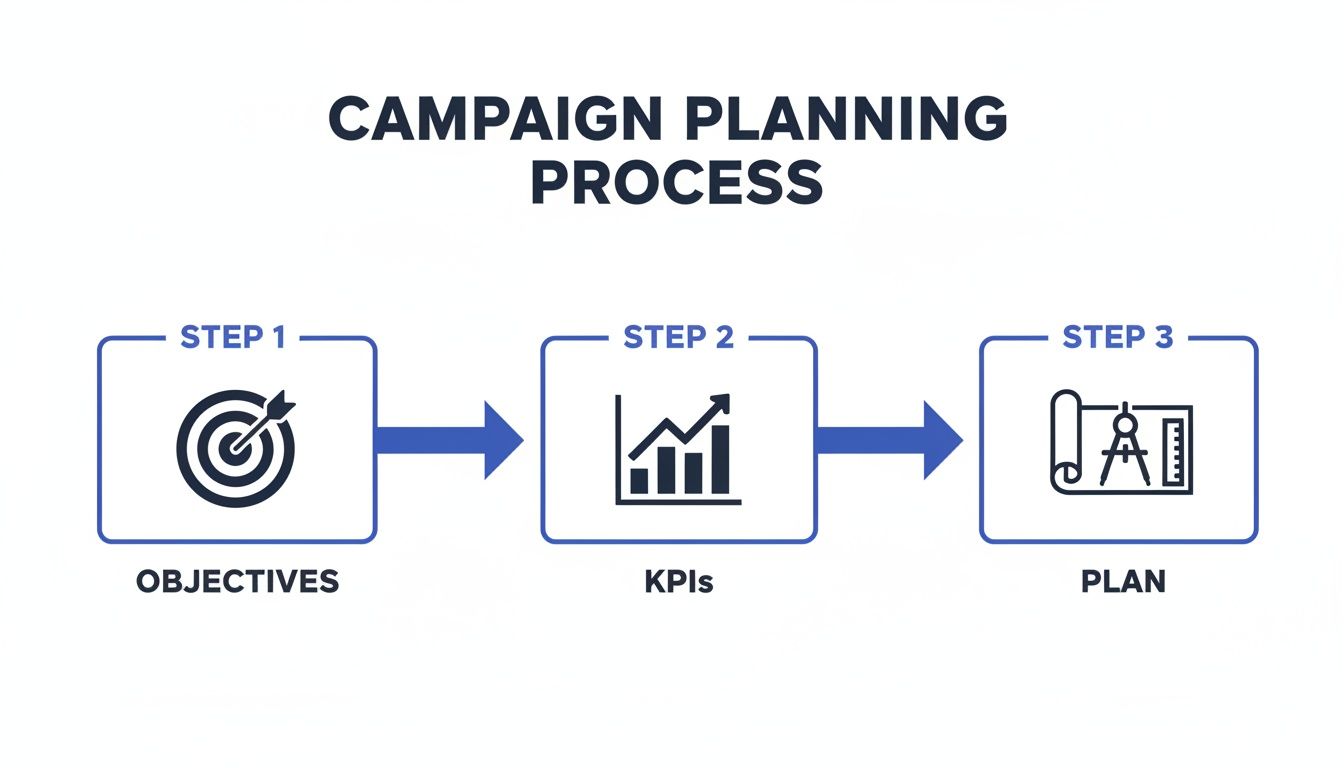
Following this workflow ensures your day-to-day tactics are always connected to a solid strategy, preventing you from wasting time and money on metrics that don't move the needle. Getting this foundation right is the most important part of the entire measurement process.
Setting Up Your Campaigns for Flawless Data Collection
With your goals locked in, it’s time to get your hands dirty with the technical setup. This is where many campaigns fall apart before they even begin. Why? Because any analysis you run is only as good as the data you feed it, and messy data leads to shaky conclusions and wasted money.
The secret to clean, trustworthy data starts with the humble UTM parameter. These are simple tags you add to the end of your URLs that tell your analytics platform exactly where each visitor came from. Skipping them is like trying to figure out which marketing channels work by pure guesswork. You'll see traffic, sure, but you'll have no idea which ads, emails, or posts are actually driving results.
Mastering UTM Parameters for Clean Data
Inconsistent tagging is a silent killer of good data. If one person on your team tags a Facebook ad with utm_source=facebook and another uses Facebook-Ads, your analytics tool will report them as two different sources. Your data gets fractured, and you can no longer see the true, combined performance of your Facebook campaigns. It's a surprisingly common and costly mistake.
The fix is simple: create a documented naming convention and make sure everyone sticks to it. No exceptions. This framework sets the rules for how you tag every single link.
A solid UTM strategy hinges on consistently using the five standard parameters. Getting these right is non-negotiable for clear attribution.
Essential UTM Parameters for Campaign Tracking
| UTM Parameter | Purpose | Example |
|---|---|---|
| utm_source | The specific platform that sent the traffic. | google, linkedin, newsletter |
| utm_medium | The marketing channel or medium. | cpc, social-paid, email |
| utm_campaign | The name of your specific campaign effort. | q3-saas-promo, summer-sale-2024 |
| utm_term | Used for paid search to identify the keyword. | privacy-analytics, utm-tracking |
| utm_content | Differentiates between ads or links in the same campaign. | blue-banner-ad, footer-link-email |
Once you have this structure, you can build powerful, descriptive URLs. For instance, a link for a paid LinkedIn ad might look like this: yourwebsite.com?utm_source=linkedin&utm_medium=social-paid&utm_campaign=q3-saas-promo&utm_content=ceo-quote-video. Now, every click from that video ad is perfectly categorized.
For a deeper dive, our complete guide on using UTM parameters covers more advanced strategies.
Tracking Conversions with Custom Events
Knowing where users come from is only half the story. You also need to know what they do once they arrive. This is where custom event tracking comes in. A custom event is any specific, meaningful action a user takes on your website beyond just viewing a page.
Think of these as the digital hand-raisers that signal real intent. They are the breadcrumbs that lead directly to revenue.
Here are a few examples of crucial custom events you should be tracking:
- Form Submissions: A lead fills out your "Request a Demo" form.
- Newsletter Signups: Someone joins your email list.
- Key Button Clicks: A visitor clicks "Add to Cart" or "Start Free Trial."
- Video Engagement: A user watches more than 75% of a key product video.
Tracking these events is what connects your traffic sources to actual business outcomes. You can finally answer questions like, "Which channel drives the most qualified leads?" instead of just, "Which channel drives the most clicks?"
Implementing Tracking Without The Technical Headaches
In the past, setting up this kind of detailed tracking required a developer and a lot of back-and-forth. Thankfully, modern tools like Swetrix have changed the game. You can now define custom events right from your dashboard, often without touching a line of code.
For example, you can easily set up an event that fires every time a user clicks a button with a specific CSS ID, like #start-trial-button. Once you define it, Swetrix starts tracking it as a conversion. This puts the power back in the hands of marketers, letting you instrument your own campaigns and ensure every important interaction is measured right from the start.
This foundation—built on consistent UTMs and well-defined custom events—is the essential plumbing for effective campaign measurement. Get this right, and you'll have a reliable stream of data to accurately attribute conversions, calculate ROI, and make smart decisions. Without it, you're just flying blind.
Choosing Metrics That Matter and Understanding Attribution
![]()
Alright, your instrumentation is set up and clean data is finally flowing in. This is where the real work begins. It’s tempting to get lost in a sea of numbers, but the biggest mistake I see marketers make is mistaking raw activity for meaningful progress.
The key is learning to separate the vanity metrics from the actionable metrics. Sure, a big spike in pageviews or social media impressions looks great on a chart, but it tells you very little about the health of your business. Actionable metrics, on the other hand, tie directly to your bottom line. Think Customer Acquisition Cost (CAC).
Moving Beyond Vanity Metrics
It's easy to get a dopamine hit from a jump in website traffic, but if none of those visitors are actually converting, you're just generating noise. Real performance is measured by metrics that reflect financial health and genuine customer behavior. When you focus on these, your entire team stays aligned with what actually moves the needle.
Here are the core financial metrics every marketer should have tattooed on their brain:
- Return on Ad Spend (ROAS): This is your most direct measure of ad profitability. It's simply the revenue from a campaign divided by its cost. A 3:1 ROAS is a common benchmark, meaning you’re making $3 for every $1 you spend.
- Cost Per Lead (CPL): This tells you how efficiently you're generating new interest. Divide your total campaign cost by the number of leads you generated. The lower, the better.
- Customer Lifetime Value (LTV): This is a forward-looking metric that estimates the total revenue a customer will bring in over their entire relationship with you. Knowing your LTV is powerful because it tells you how much you can afford to spend to acquire a customer in the first place.
When you start tracking these numbers, your entire perspective shifts. You stop managing campaigns and start investing in growth, asking much smarter questions about what's truly driving profit.
The goal isn't just to be busy; it's to be profitable. Shifting your focus from impressions to metrics like LTV and ROAS is what separates good marketers from great ones. It ensures every decision is grounded in its potential financial impact.
Decoding Attribution Models
Now for the really tricky part: attribution. A customer might see a Facebook ad on Monday, read a blog post you wrote on Wednesday, and then click a Google ad on Friday before finally buying. So, who gets the credit? This is the central question attribution models try to answer.
Choosing the right model is critical because it directly impacts how you allocate your budget. It’s the framework you use to decide which touchpoints in a customer's journey were most valuable.
Marketing measurement has come a long way. Decades ago, we were stuck with basic response rates and had almost no visibility into the customer journey. Today, things are far more sophisticated. In fact, recent BCG research shows that nearly half (46%) of marketers are now using a blend of Marketing Mix Modeling (MMM), incrementality testing, and multi-touch attribution (MTA) to get the full picture.
Common Attribution Models Compared
There’s no single "best" model—the right choice really depends on your sales cycle, your business, and your goals. Let's break down the most common ones.
Last-Touch Attribution: This is the default for many platforms and the simplest to understand. It gives 100% of the credit to the very last channel the customer interacted with before converting. It's easy to track but notoriously overvalues bottom-of-funnel channels like branded search, making them look more effective than they really are.
First-Touch Attribution: As you might guess, this is the opposite. It gives 100% of the credit to the very first channel that introduced a customer to your brand. It's great for figuring out which channels are your best awareness drivers.
Multi-Touch Attribution: This is where things get more nuanced, with credit distributed across multiple touchpoints. There are a few popular flavors:
- Linear: Spreads credit equally across every single touchpoint. Simple, but maybe not totally realistic.
- Time-Decay: Gives more credit to the touchpoints that happened closer to the final conversion.
- U-Shaped: A balanced approach that gives 40% of the credit to the first touch, 40% to the last touch, and divides the remaining 20% among all the interactions in the middle.
For most businesses I’ve worked with, a multi-touch model gives a much more realistic view of how different channels collaborate. It acknowledges that the customer journey is messy and helps you appreciate the value of both your top-of-funnel awareness efforts and your bottom-of-funnel conversion tactics.
Turning Your Data Into Actionable Optimizations
Collecting clean, accurate data is a huge first step, but it's really just the starting point. The real magic happens when you turn those numbers into smarter marketing decisions that actually move the needle. This is where you shift from just watching metrics to actively improving them.
The whole point is to build a continuous feedback loop: you test an idea, measure the results, learn from it, and do it all over again. By systematically analyzing what’s happening, you can stop guessing what works and start making changes based on what your users are truly doing.
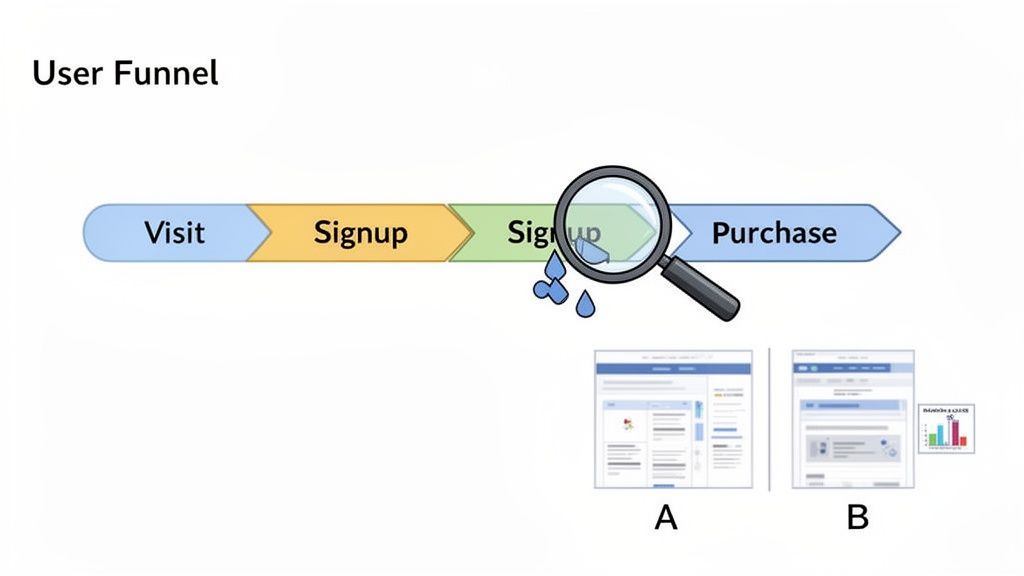
Building Funnels to Pinpoint Drop-Offs
One of the best ways to see your customer's journey in black and white is to build a user funnel. A funnel simply tracks the series of steps someone takes to complete a goal, whether that's buying a product or signing up for a demo. It’s a powerful tool because it immediately shines a spotlight on exactly where people are losing interest and abandoning the process.
Let's imagine a basic e-commerce funnel:
- Visited Product Page: 1,000 users
- Added to Cart: 200 users (a massive 80% drop-off)
- Initiated Checkout: 150 users (a 25% drop-off)
- Completed Purchase: 100 users (a 33% drop-off)
That 80% drop-off between viewing a product and adding it to the cart is a major red flag. Right away, this data gives you a very specific problem to investigate. Is the "Add to Cart" button hidden? Is the price not what they expected? Funnels are fantastic for turning vague "something's wrong" feelings into focused problems you can actually solve.
The Power of Segmentation
Here's a hard truth: not all of your users are the same. Lumping everyone together in your analysis can hide some incredibly important insights. That's where segmentation comes in—it's the practice of slicing your audience into smaller groups based on shared traits.
By breaking down your data, you can start answering the kinds of questions that lead to real breakthroughs:
- By Marketing Channel: Is traffic from LinkedIn converting better than traffic from Google Ads? Maybe it’s time to shift some budget around.
- By Device: Is your mobile conversion rate tanking compared to desktop? It’s a good bet your mobile checkout flow is clunky or broken.
- By Geography: Are users from Canada bouncing off a landing page instantly? It could be a simple currency or language issue you've overlooked.
Without segmenting, you might look at a campaign's overall numbers and think it’s a failure. But in reality, it could be a massive success with one specific audience and a total flop with another. You can dive deeper into this with our guide to conversion rate optimization best practices.
Using A/B Testing for Confident Decisions
So, you've used funnels and segmentation to find a problem. Now what? How do you know if your brilliant idea for a fix will actually make things better?
You A/B test it.
A/B testing is where you create two versions of something—a webpage, an email, an ad—and show each version to a different slice of your audience. You have your "A" version (the original, or control) and your "B" version (the new one with your proposed change).
The goal is to see which one performs better for a specific metric, like getting more clicks or sign-ups. But just running a test isn't enough; you have to make sure your results are statistically significant.
Statistical significance has emerged as a fundamental principle for validating marketing campaign effectiveness, fundamentally changing how organizations interpret campaign results and make investment decisions. The most reliable approach to measuring campaign effectiveness involves splitting the target audience into test and control groups, then comparing the resulting behavior patterns between these two cohorts. To determine statistical significance, marketers calculate p-values for each test, with a p-value of 0.05 serving as the standard threshold for indicating significance. When a campaign achieves statistical significance, it demonstrates that the observed results were most likely not due to chance, providing reliable estimates of the campaign's true effect on its target audience. Discover more insights about statistical significance in marketing at Optimove.com.
This disciplined approach stops you from making big, potentially costly changes based on what could just be random luck. For example, if you test a new headline and see a 2% lift in conversions with only 100 visitors, that's probably just noise. But if you see that same 2% lift with 100,000 visitors and a low p-value? That’s a real win you can roll out with confidence. This is how you make small, data-backed improvements that add up to big results over time.
Creating Dashboards and Reporting Workflows That Stick
One-off reports are fine for a quick snapshot, but they don't build momentum. To really understand your marketing effectiveness over the long haul, you need a system—a consistent, repeatable way to monitor performance without having to pull manual reports every week. The aim here is to build a "single source of truth" that keeps the entire team aligned and focused on the right things.
This means shifting from reactive analysis to proactive monitoring. Instead of digging through data after a problem crops up, a solid workflow should surface important changes as they happen. You get there with a combination of clear dashboards and automated alerts.
A great marketing dashboard isn't just a data dump. It's a curated, visual summary of your most critical KPIs, built to be understood in seconds, not minutes. Think of it as the command center for your marketing efforts, giving you an at-a-glance view of campaign health.
Designing a Dashboard That Actually Gets Used
The best dashboards I've ever seen tell a story. They guide you from the high-level business outcomes right down to the specific channels driving those results. They also know their audience. A dashboard for the C-suite will be all about ROI and CAC, while the paid media team needs to see ROAS and CPC broken down by campaign.
To make your dashboard instantly actionable, structure it around the marketing funnel. This creates a logical flow and shows you exactly how your top-of-funnel activities are (or aren't) translating into bottom-of-funnel results.
Here’s a simple way to think about structuring your own dashboard. The idea is to connect the dots between what people see and what they ultimately do.
Example Marketing Dashboard Components
| Funnel Stage | Key Metric | Purpose |
|---|---|---|
| Awareness | Impressions & Reach | Tracks the overall visibility of your campaign. |
| Acquisition | Website Traffic by Source | Shows which channels are driving visitors. |
| Activation | Conversion Rate (Leads) | Measures how effectively you turn traffic into interest. |
| Revenue | ROAS & CAC | Connects marketing spend directly to financial outcomes. |
This kind of structure gives you a clear narrative. Building a dashboard like this doesn't have to be a huge project. Tools like Swetrix have user-friendly interfaces to create custom views. You can get some fantastic ideas by checking out how to build a web analytics dashboard that presents data clearly and effectively.
Setting Up Proactive Alerts for Real-Time Insights
Dashboards are perfect for your scheduled check-ins, but what about the unexpected? A sudden drop in your conversion rate or a broken checkout link can cost you thousands before your weekly review even comes around. This is where automated alerts become your safety net.
These are essentially simple "if-then" triggers that ping you when a key metric goes haywire. They let you respond to threats and opportunities almost instantly, turning your measurement system into an active defense for your marketing performance.
Setting up alerts transforms your analytics from a passive reporting tool into an active monitoring system. It's the difference between reading a history book and getting a breaking news update.
Here are a few alerts that I believe every marketing team should have running:
- Sudden Traffic Spike: A notification if a specific page gets 500% more traffic than its daily average could mean a piece of content just went viral. Jump on it!
- Conversion Rate Crash: An alert if your main goal's conversion rate drops by more than 30% in 24 hours can help you spot a broken form or payment gateway before it does real damage.
- Ad Spend Anomaly: Get pinged if a campaign’s daily spend suddenly jumps. This can prevent a simple misconfiguration from blowing your entire budget.
Platforms like Swetrix make it easy to create these custom alerts and send them straight to your team's Slack, Discord, or Telegram. This closes the loop. It ensures critical data doesn't just sit in a dashboard but actually triggers a real-world response. When you combine a clear dashboard with smart alerts, you create a reporting workflow that doesn't just measure performance—it actively protects it.
FAQs: Navigating the Nuances of Campaign Measurement
As you start putting all this into practice, you're bound to hit a few snags. That's completely normal. The journey from tracking to true understanding isn't always a straight line, and I've seen the same questions pop up time and time again from marketers trying to get a handle on their data.
Let's tackle some of the most common hurdles you'll face.
How Often Should I Actually Check My Campaign Performance?
Honestly, there’s no magic number here—it really hinges on the campaign's pace and budget. The best rule of thumb I've found is this: the shorter the buying cycle and the bigger the ad spend, the more frequently you need to be in there.
Think about a high-stakes, fast-moving campaign, like a Black Friday push on social media. For something like that, daily check-ins are non-negotiable. You're looking to spot underperforming ads and shift budget to the winners in real-time. Hesitate for a day, and you could burn through a significant chunk of your budget with nothing to show for it.
On the other hand, for a slow-burn strategy like an SEO initiative or a content marketing funnel, a weekly or bi-weekly review makes way more sense. These channels need time to marinate and show results. Daily peeks will just drive you crazy with meaningless fluctuations. The bigger picture emerges over weeks, not hours. Save the monthly and quarterly reviews for high-level strategy, where you're asking, "Is this entire channel pulling its weight against our business goals?"
What Are the Biggest (and Most Common) Mistakes to Avoid?
I see one mistake more than any other, and it's a killer: chasing vanity metrics. Getting caught up in likes, impressions, or a spike in pageviews feels good, but it often has zero impact on the bottom line. You have to constantly pull yourself back to the metrics that actually grow the business, like qualified leads, revenue, and Customer Acquisition Cost (CAC).
A few other classic blunders to watch out for:
- Sloppy UTM Tagging: This is the silent killer of good data. When one person on your team uses
facebookand another usesFacebook_Ads, your analytics tool sees them as two different sources. Your data gets fragmented, and you can't get a clean read on what's truly working. - Forgetting Conversion Tracking: In the rush to get a campaign live, it’s surprisingly easy to forget to set up conversion tracking for the most important actions, like a form fill or a purchase. If you don't do this from day one, you're essentially flying blind.
- Jumping to Conclusions on Small Data Sets: This is a big one. It's so tempting to declare a winner in an A/B test after just a handful of conversions, but it's a recipe for disaster. You have to wait for statistical significance, otherwise, your "winning" ad might just be the result of random luck.
How Can I Measure Offline Campaigns Like Print Ads or Events?
The trick to measuring offline efforts is to build a clear digital bridge. You need a simple, trackable way for someone to get from that magazine ad or event flyer to your website. The key is giving each offline source a unique digital fingerprint.
For instance, if you're running a print ad, don't just slap your homepage on it. Create a memorable vanity URL like yoursite.com/deal that redirects to a landing page already tagged with specific UTM parameters.
A great offline tracking URL might redirect to something like this:
yoursite.com/specialoffer?utm_source=magazine&utm_medium=print&utm_campaign=q4-promo. Anyone who types in that simple vanity URL gets tagged automatically, letting you see exactly how many people—and conversions—came from that specific ad.
You can apply the same logic with unique QR codes on your event banners or exclusive discount codes you announce on a podcast. The goal is always the same: give each offline channel its own unique, trackable entryway.
How Does Privacy-First Analytics Change All of This?
The shift to privacy-first analytics is less about losing data and more about changing your perspective. It’s a move away from tracking individuals with cookies and toward understanding user behavior in an aggregated, anonymous way.
With a tool like Swetrix, you still get all the critical campaign data you need—traffic sources from UTMs, conversion rates, and funnel performance. The crucial difference is that this information isn't tied to an individual's personal data. You're measuring actions, not people. This approach not only keeps you compliant with regulations like GDPR and CCPA but also builds trust with your audience without forcing you to sacrifice a data-driven strategy.
Ready to measure your campaigns with confidence? Swetrix gives you a powerful, privacy-first analytics platform with all the tools you need—from UTM tracking and custom events to funnel analysis and automated alerts—without compromising user privacy. Start your 14-day free trial and see what you've been missing.