- Date
How to Analyze Website Traffic for Actionable Growth
 Andrii Romasiun
Analyzing your website traffic isn't just about counting visitors; it's about understanding them. To do it right, you need to turn raw data into a real growth strategy. This whole process boils down to three core ideas: picking the right tool, defining what success actually looks like for you, and slicing your audience data to find those "aha!" moments.
Ultimately, you're looking for patterns that turn clicks into customers.
Laying the Groundwork for Smart Traffic Analysis
Let's be honest—opening an analytics dashboard for the first time can be a bit much. You’re hit with a wall of charts, graphs, and numbers, and it’s easy to feel lost. The trick is to step back and create a simple framework before you dive into the data. The goal isn't just to watch traffic numbers go up; it's to understand the people behind those numbers and what they need from you.
A solid foundation means connecting your data directly to business goals. Forget vanity metrics like total page views for a moment. If you're a startup, you probably care more about demo requests. If you run an e-commerce site, it's all about completed sales.
This simple flowchart breaks down the foundational process perfectly.
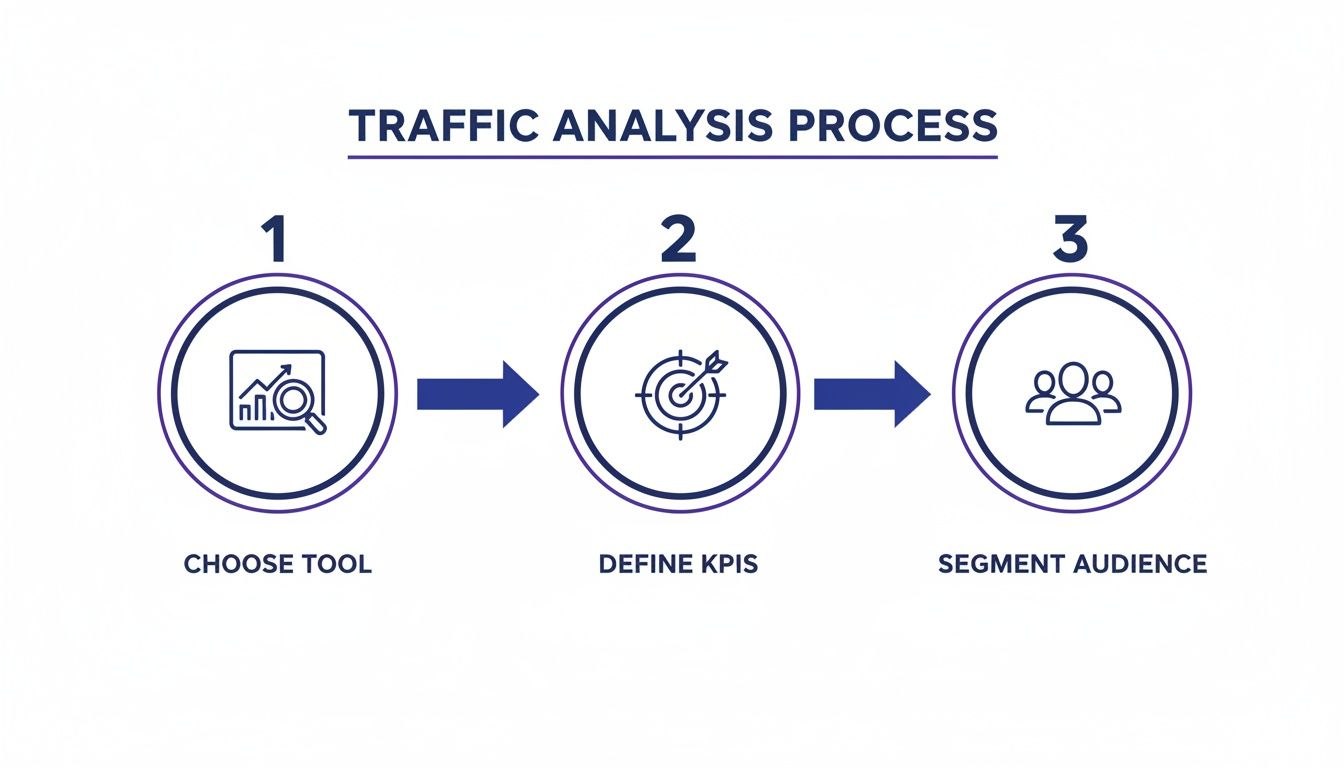
This approach keeps your analysis strategic, moving from the basic setup to clear goals and then into a deeper investigation.
Choosing Your Toolkit and Defining Success
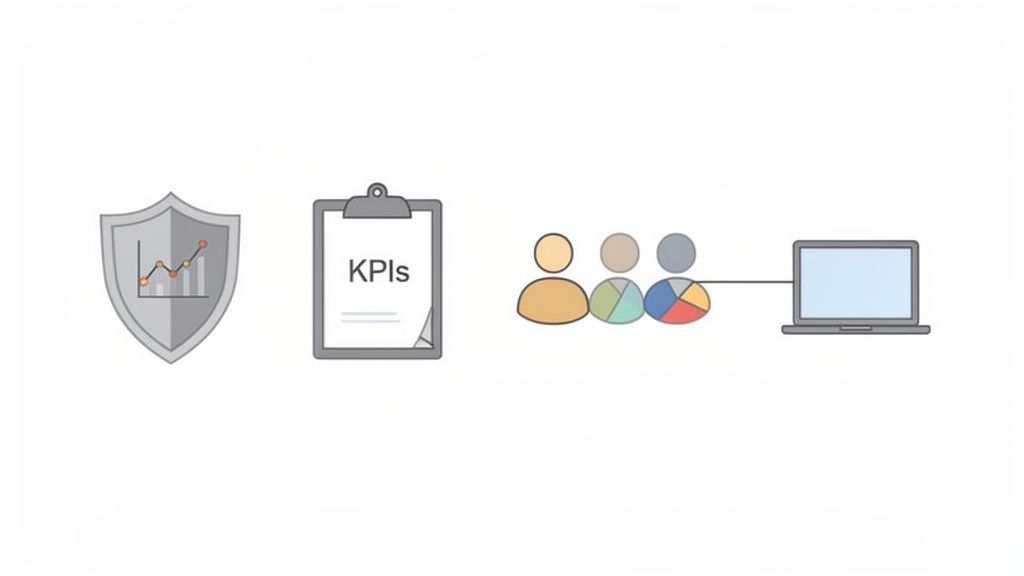
First things first, you need an analytics platform. With privacy becoming more important every day, starting with a privacy-first tool is a smart move that builds trust from the get-go. A platform like Swetrix gives you all the crucial insights you need without harvesting user data, making it a powerful and ethical choice.
Once you have your tool, it’s time to define your Key Performance Indicators (KPIs). These are the handful of metrics that tell you if you’re actually making progress. Don't just track everything; focus on the numbers that directly impact your business.
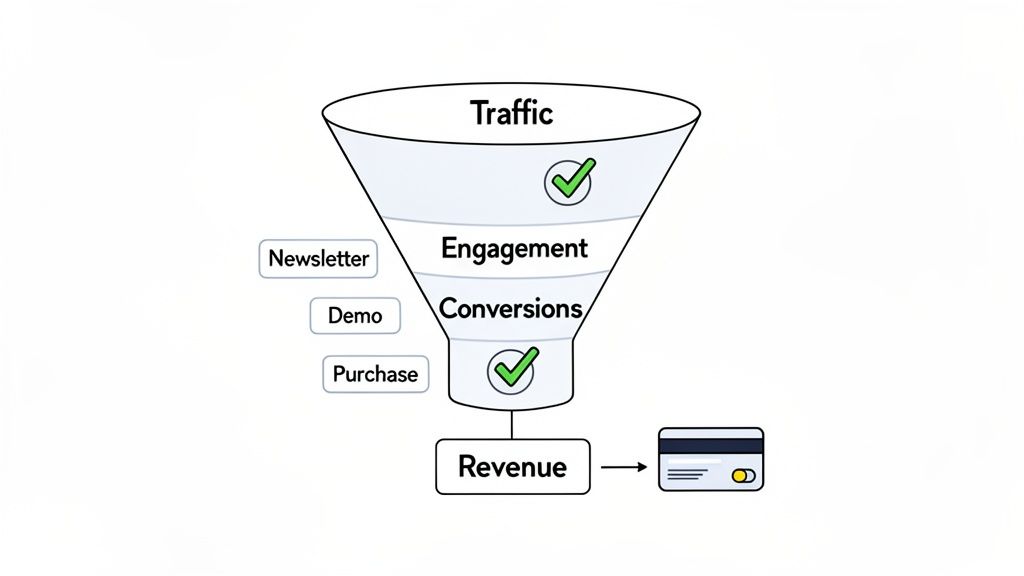
We can break these down into a few key areas:
- Acquisition: How are people discovering you? Keep a close eye on your traffic sources, like Organic Search, Social Media, and Referrals.
- Engagement: What happens after they land on your site? Look at metrics like average session duration, pages per session, and the notorious bounce rate.
- Conversion: Are visitors doing what you want them to do? This is where you measure things like newsletter signups, form submissions, or actual sales.
A quick note on bounce rate: a high number isn't always bad. If someone lands on a blog post, gets the exact answer they needed, and leaves, that's a win! Context is everything.
Core Website Metrics and Their Business Impact
To make this even clearer, here’s a breakdown of the most common metrics, what they actually measure, and why they should matter to your business.
| Metric | What It Measures | Why It Matters for Your Business |
|---|---|---|
| Unique Visitors | The number of distinct individuals visiting your site in a given period. | Shows the actual size of your audience and the reach of your brand. |
| Session Duration | The average amount of time a user spends on your site during a single visit. | A longer duration often indicates that your content is engaging and relevant. |
| Bounce Rate | The percentage of visitors who leave after viewing only one page. | Helps you identify pages that aren't meeting user expectations or have a poor UX. |
| Conversion Rate | The percentage of visitors who complete a desired action (e.g., purchase, signup). | This is the ultimate measure of your website's effectiveness at achieving goals. |
| Traffic by Source | Where your visitors are coming from (e.g., Google, Facebook, another website). | Tells you which marketing channels are working and where to invest your efforts. |
| Pages per Session | The average number of pages a user views during their visit. | Indicates how well your site encourages exploration and discovery. |
Thinking about these metrics helps you move beyond just counting visitors and start understanding their behavior in a way that informs real business decisions.
Uncovering Insights Through Audience Segmentation
This is where the real magic happens. Instead of viewing your audience as one giant, faceless group, you need to break it down into smaller segments. This is called segmentation, and it’s how you find your most valuable insights.
For example, you could compare the behavior of mobile users to desktop users. Or see how new visitors interact with your site differently from returning customers.
This is how you uncover the hidden patterns. You might find that visitors from a specific country convert at 2x the average rate, or that people who visit your "About Us" page are 50% more likely to buy something. These are the kinds of powerful insights that fuel smart experiments and drive sustainable growth.
Understanding Where Your Traffic Comes From
If you want to get smart about your marketing budget, you first need to know where your visitors are actually coming from. Your traffic sources dashboard tells a story—it reveals your brand's reach and whether your campaigns are hitting the mark. This is the difference between throwing money at different channels and knowing exactly which ones are paying off.
Every traffic source sends a signal. For example, a healthy amount of direct traffic is a fantastic sign. It means people know your brand well enough to type your URL directly into their browser or click a bookmark. That’s loyalty right there.
Breaking Down the Main Traffic Channels
To make sense of the data, you have to understand what each channel represents. Think of them as different paths people take to find you.
- Direct Traffic: As I mentioned, these are the visitors who show up without a clear digital trail. This could be from offline marketing (like a podcast shoutout), strong brand recognition, or simply your regulars returning.
- Organic Search: This is pure gold. It’s traffic from search engines like Google or DuckDuckGo. Lots of organic traffic means your SEO is working and your content is connecting with what people are searching for.
- Referral Traffic: These visitors clicked a link on another website to land on yours. A sudden spike here might mean you got a mention in a blog post, a partner linked to you, or you were featured in an industry roundup.
- Social Traffic: This bucket captures everyone who arrives from platforms like X (formerly Twitter), LinkedIn, or Instagram. It’s a direct reflection of your social media game.
Getting a handle on your traffic mix is crucial. For context, global data shows that direct traffic often makes up around 58% of visits, followed by organic search at 29%. Referrals and social media typically sit at 8% and 2%, respectively. Seeing how your site stacks up can be pretty eye-opening.
From Data Points to Strategic Partnerships
Let's put this into a real-world scenario. Imagine you log into your analytics and see a 300% jump in referral traffic this week. That's not just a number on a screen; it's an opportunity.
Your first move should be to dig into the specific referring domains. In a privacy-first tool like Swetrix, you can easily see which sites are sending you this new wave of visitors. Let's say you discover that a popular industry blog wrote a glowing review of your product, and it's sending a stream of high-intent users your way.
This is your cue to act. The data didn't just tell you that this audience is a good fit—it handed you a warm introduction. Reach out to the blog's editor, thank them for the feature, and start a conversation. Maybe a joint webinar or an affiliate program could be next.
This is how you turn passive data-gazing into active business development. You’re no longer just watching trends; you’re using them to forge relationships that will drive real growth.
Using UTMs to Measure Campaign ROI
While knowing the general source is great, you need more granularity to measure the impact of specific marketing efforts. That’s where UTM parameters come in. They’re just little tags you add to the end of a URL to tell your analytics tool exactly where a click came from.
For instance, with UTMs, you can finally distinguish traffic from:
- Your weekly email newsletter
- A specific Facebook ad you're running
- The link in your X profile bio
By layering UTM data over your source analysis, you can attribute sign-ups, sales, or any other conversion directly to a specific action you took. You can finally get clear answers to questions like, "Did our last newsletter actually make us money?" or "Which ad creative is the real winner?" This level of clarity is non-negotiable for making smart budget decisions.
If you want to dive deeper, you can also check out our complete guide on website traffic sources for more advanced strategies.
Mapping Your User Journey and On-Site Behavior
Knowing where your visitors are coming from is a good start, but it's only half the story. The real magic happens when you dig into what they do after they land on your site. Mapping the user journey is all about connecting the dots from their first click to their final action—be it a purchase, a signup, or simply leaving.
By looking closely at this on-site behavior, you can find out which pages are pulling their weight, where your navigation is causing confusion, and exactly where you’re losing people’s attention. It’s the difference between seeing a crowd and understanding the dance.
Uncovering Common Paths with User Flow Reports
Most analytics tools have a user flow or path analysis report, and it’s one of the most powerful features you can use. Think of it as a trail map of your website, showing you the most common routes people take from one page to the next. You'll see the superhighways and the weird little detours you never expected.
For instance, an e-commerce shop might see a surprising number of people go from a product page straight to the 'About Us' page before buying anything.
That’s not a random click. It's a clear signal that your brand story and trust signals are a huge part of the buying process. With that knowledge, you could start testing things like adding team photos or customer testimonials directly on your product pages to build that confidence sooner.
This is how you graduate from just watching traffic to truly understanding intent. You start to see the why behind the clicks.
Identifying Your Most Valuable Content
Your top pages report is another absolute goldmine. At first glance, it just shows which pages get the most hits, but the real value is unlocked when you start layering engagement metrics over those pageviews. You're looking for the sweet spot: pages with high traffic and high engagement (like long visit times) or high conversion rates.
These are your content superstars—the MVPs doing the heavy lifting for your business.
- High-Traffic Blog Posts: Are these just getting views, or are they working for you? Maybe you can add a stronger call-to-action (CTA) to convert those readers into subscribers.
- Popular Product Pages: What's the secret sauce here? Dive into the copy, the images, and the layout to see what you can learn and apply to the pages that aren't doing so well.
- Frequently Visited FAQ Pages: These are basically a cheat sheet for your customers' biggest questions and worries. Use them to fine-tune your messaging or create new, hyper-relevant content.
When you focus on what's already working, you can make small tweaks that often lead to big wins.
The Critical Role of Website Performance
Look, you can have the most brilliant design and content in the world, but if your site is slow, none of it matters. Website performance isn't just a technical problem for developers to worry about anymore; it’s a cornerstone of the user experience and a massive factor in your traffic analysis. Slow-loading pages are almost always the main culprit behind high bounce rates.
The link between speed and keeping users around is shockingly direct. Research shows that 88.5% of visitors will leave a website if it doesn't load fast enough. On the flip side, pages that load in just one second can see conversion rates jump to nearly 40%. You can explore more data on this in a detailed website statistics report. Performance has a real, measurable impact on your bottom line.
To get to the bottom of these issues, you need more than basic pageview counts. This is where tools offering Real User Monitoring (RUM) are invaluable. RUM tools collect performance data from your actual visitors' sessions, so you can see exactly which pages are slow and for whom (like people on mobile networks or in certain countries).
When you spot a page with a high exit rate and slow load times, you've found your smoking gun. You now have a clear, data-backed reason to investigate. You can go to your development team with specific information—like a slow database query or a massive unoptimized image—instead of a vague complaint like "the site feels slow." That turns a frustrating problem into an actionable ticket that can be fixed, directly improving your user journey and conversions.
How to Set Up Goals and Track Conversions
Raw traffic numbers are a nice vanity metric, but they don't pay the bills. The real goal of analyzing your website traffic is to figure out which user actions actually move the needle for your business. This is where conversion tracking comes in—it’s how you turn a passive analytics report into an actionable growth playbook.
A "conversion" is just any meaningful action a visitor takes. It doesn't have to be a purchase. It can be anything that signals a user is moving closer to becoming a customer, from signing up for a newsletter to starting a free trial. The trick is to define what matters to your business and then measure it obsessively.
Defining Your Core Business Actions
Before you track anything, you need to know what to track. Sit down with your team and map out the key actions that tell you a visitor is genuinely engaged and on the right path.
These actions are typically set up as custom events or goals in your analytics tool, and they'll be unique to your business model.
- For a SaaS Company: A critical event might be a user starting a free trial or requesting a demo. For product teams, tracking when a user engages with a new feature for the first time is incredibly valuable for gauging adoption.
- For an E-commerce Store: The obvious goals are
add_to_cartandpurchase. But don't stop there—you could also track newsletter signups from a pop-up or downloads of a seasonal catalog. - For a Content-Driven Site: Key actions might include subscribing to a newsletter, downloading a whitepaper, or clicking an affiliate link.
Once you’ve identified these actions, you need to set them up as trackable events. Our comprehensive event tracking guide provides a detailed walkthrough on how to get this done right. This step is what turns abstract user behavior into concrete, measurable data.
Building Funnels to Pinpoint Drop-Offs
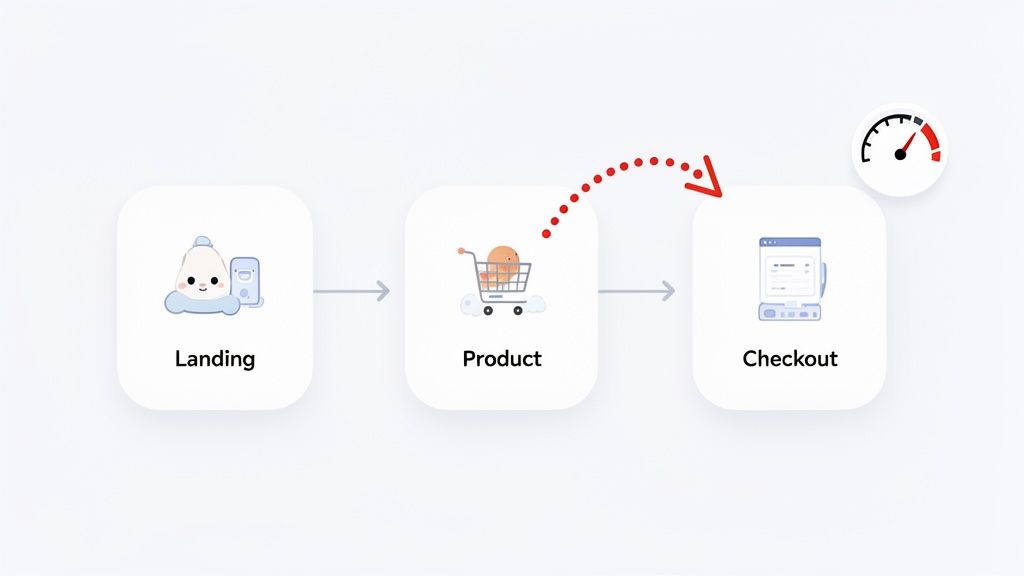
With your key conversion events in place, you can now start visualizing the journey users take to complete them. This is where conversion funnels are indispensable. A funnel is simply a series of steps you expect a user to take to complete a goal, like viewing a product, adding it to their cart, and finally checking out.
By building a funnel in your analytics platform, you can see exactly where people are bailing on the process.
Let’s say your e-commerce checkout funnel shows that 80% of users who add an item to their cart proceed to the shipping page. But from there, only 30% make it to the payment page. That’s a massive drop-off, and it’s a huge red flag. It immediately tells you something is wrong on the shipping page—maybe it’s unexpected costs, or maybe the form is just too clunky.
This insight is pure gold. Instead of just guessing why sales are down, you have a specific, data-backed problem to investigate. You can now form a solid hypothesis—"Simplifying the shipping address form will increase conversions"—and run an A/B test to prove it.
Connecting Revenue to Traffic Sources
For any business selling directly on its website, the holy grail is tying revenue back to its source. Knowing that a specific marketing campaign didn't just bring in clicks but generated $5,000 in actual revenue changes everything.
This is where integrating your analytics with payment platforms like Stripe or Paddle becomes a game-changer.
By connecting these systems, you can see exactly which traffic sources, ad campaigns, or even which blog posts are driving the most revenue. You might discover that while your social media ads generate tons of traffic, visitors from organic search have a 3x higher lifetime value (LTV). This kind of ROI clarity gives you the confidence to double down on what works and cut spending on channels that only look good on the surface. You're finally closing the loop between traffic and profit.
Turning Your Data Into Actionable Experiments
So, you’ve dug through your analytics and found some interesting stories about how people are using your site. That's a great start, but those stories are just trivia until you do something with them. The real magic happens when you translate those hard-won insights into actual experiments. This is where you stop being a passive observer and start actively shaping your website's future.
Data without action is just numbers on a screen. The goal here is to build a repeatable cycle: analyze, form a hypothesis, test it, and learn from the results. This is the engine that drives real, sustainable growth.
From Observation to Hypothesis
Every meaningful experiment starts with a solid hypothesis. Think of it as an educated guess rooted in your data, not just a random gut feeling. Once you’ve pinpointed a problem or an opportunity, the next step is to frame it as a clear, testable statement.
I've always found this simple framework incredibly powerful for keeping experiments focused:
Based on [a specific data insight], we believe that [making this change] for [this specific audience] will result in [a measurable outcome].
Let’s walk through a real-world example. Say you've analyzed your conversion funnel and see a massive 60% drop-off on your pricing page, but only for people on mobile devices.
Using the framework, your hypothesis might be: "Based on the high mobile bounce rate on our pricing page, we believe that simplifying the pricing tiers into a single-column layout for mobile visitors will result in a 15% increase in clicks on the 'Start Trial' button."
See how that works? It forces you to connect every change directly to a data point and a specific, measurable goal. No more guessing.
Running Effective A/B Tests
With a clear hypothesis in hand, it's time to put it to the test. The gold standard for this is A/B testing (or split testing). You create two versions of a page: version "A" is the original, and version "B" has your proposed change. Then, you show each version to a different segment of your audience and see which one performs better.
This method gives you clean, reliable data on whether your change actually moved the needle.
A/B testing is invaluable in countless scenarios, but here are a few common ones:
- Improving Landing Page Conversions: Test different headlines, calls-to-action (CTAs), or hero images to see what really grabs new visitors.
- Optimizing Pricing Pages: Experiment with different plan layouts, feature callouts, or even the wording on your pricing tiers.
- Reducing Checkout Abandonment: Try simplifying a form, adding trust signals like security badges, or clarifying shipping info upfront.
If you want to go deeper on structuring tests that deliver real results, our guide on conversion rate optimization best practices is a great next step.
Using Feature Flags for Product Rollouts
For product and dev teams, the stakes are often higher than a simple copy change. Launching a brand-new feature to your entire user base at once can be terrifying. What if there's a critical bug? What if users hate it? This is where feature flags save the day.
Think of a feature flag as a light switch for your code. It lets you turn a new feature on or off for specific groups of users without having to deploy a new version of your app. For data-driven product development, this is a game-changer.
Instead of a stressful, all-or-nothing launch, a product team can:
- Release Safely: Roll out a new feature to just 1% of users, or maybe only to internal team members to start.
- Monitor Impact: Use your analytics to watch how this small segment interacts with the new feature. Are they even using it? Is it causing errors or performance lags?
- Gather Feedback: Collect direct feedback from this initial group to catch problems when they're still small.
- Iterate or Expand: Based on the data, you can either fix issues and keep testing or, if the results look good, gradually roll the feature out to more and more of your users.
This approach takes the risk out of big launches and ensures your product decisions are based on what users actually do, not just what you think they'll do. It turns release day from a high-anxiety event into a controlled, measurable experiment.
Frequently Asked Questions
Getting into website analytics always kicks up a few questions, especially when you're just starting to dig into the data. I've pulled together some of the most common ones we hear to give you straight, practical answers.
The goal here is to cut through the noise and give you clear advice you can start using today, all while keeping modern, privacy-first practices in mind.
How Often Should I Check My Website Traffic?
Honestly, there's no magic number. The right cadence really depends on your traffic volume and what stage your business is in. The key is finding a rhythm that helps you stay proactive, not just reactive.
For most businesses, a weekly check-in is a great starting point. It’s frequent enough to catch important trends or sudden problems—like a broken link tanking your conversions—without getting bogged down in the daily fluctuations that don't mean much.
Then, schedule a deeper dive once a month. This is your time to zoom out, look for bigger patterns, see how you’re tracking against your KPIs, and make smart decisions for the month ahead. The one exception? If you've just launched a big campaign or a new feature, you'll probably want to peek at the key metrics daily for the first week to see how it's landing.
What’s a Good Bounce Rate?
This is the classic "it depends" question. A "good" bounce rate is completely contextual. For a blog post, a visitor might arrive, find the answer they need, and leave. An 80% bounce rate there? Totally fine. They got what they came for.
But for a landing page designed to capture leads, an 80% bounce rate is a red alert. It’s a huge signal that your page isn't connecting with visitors or your call-to-action is falling flat.
Instead of chasing a universal "good" number, benchmark your bounce rate against your own pages. Find the pages with a much higher bounce rate than your site-wide average. Those are your prime candidates for optimization.
Can I Really Analyze Traffic Without Invading User Privacy?
You absolutely can. In fact, it's quickly becoming the standard for any business that wants to build trust. Older analytics tools often lean on cookies and tracking methods that harvest personal data, which is a massive concern for users and a headache for regulatory compliance.
That's where privacy-first analytics platforms come in. They’re built from the ground up to give you the insights you need without compromising user privacy.
- Cookieless by design: These tools don't use persistent cookies, so they aren't following your visitors around the internet.
- Anonymized data: All the information collected is anonymous. You're looking at aggregate trends, not creepy individual profiles.
- Built for compliance: They're designed to meet regulations like GDPR and CCPA right out of the box.
Using a privacy-focused tool like **Swetrix** means you don’t have to pick between getting good data and doing right by your users. You get a crystal-clear view of your website’s performance while earning your audience's trust.
What's the Difference Between a Session and a Pageview?
Getting this distinction right is fundamental. They might sound similar, but they measure two very different aspects of how people interact with your site.
A pageview is just what it sounds like: a single instance of a page being loaded in a browser. If someone lands on your homepage, clicks to your about page, and then clicks back to the homepage, that’s three pageviews. Simple as that.
A session, on the other hand, is the entire container for a user's visit. It starts the moment they arrive and ends after a period of inactivity (usually 30 minutes). Every pageview, click, and event they trigger during that time belongs to that one session. In our example above, those three pageviews all happened within a single session. Looking at sessions helps you understand the entire user journey, not just a series of isolated page loads.
Ready to analyze your website traffic without compromising on privacy? Swetrix provides the powerful, ethical analytics you need to make data-driven decisions. Get started with our 14-day free trial and see your data in a new light.