- Date
Cookieless Analytics For Shopify Stores In 2026
 Andrii Romasiun
Managing analytics for Shopify stores requires exact numbers. Visitors abandon carts, reject consent notifications, and use ad blockers. Default tracking setups miss these events, leaving merchants blind to actual buyer behavior. Fixing this measurement gap restores visibility into the customer journey.
The State of Shopify Benchmarks in 2026
Over 5.6 million Shopify stores operate across the globe. Researchers at TechnologyChecker place the platform's market share at 26% across global ecommerce. Competing against this volume demands a baseline understanding of standard performance metrics.
Comparing Your Store to Top Performers
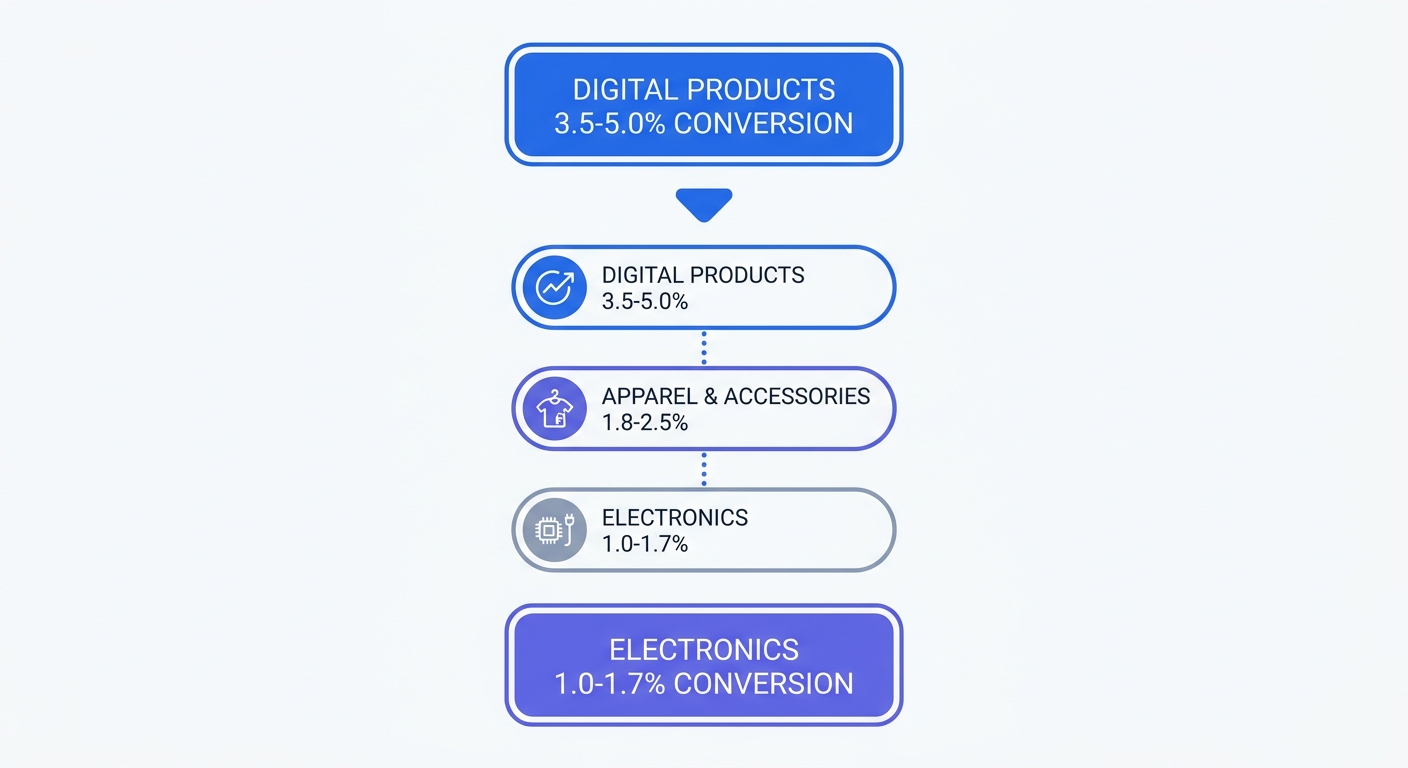
A median Shopify conversion rate falls between 1.4% and 1.8%, while elite brands in the top 10% hit 4.7% or higher. These metrics fluctuate by industry, product category, and content type.
| Industry | Average Conversion Rate |
|---|---|
| Digital Products | 3.5% - 5.0% |
| Health & Beauty | 2.8% - 3.6% |
| Fashion & Apparel | 1.2% - 2.2% |
| Electronics | 1.0% - 1.7% |
Open the Shopify admin dashboard to pull the store's overall conversion rate. Navigate to Analytics and click Reports. Select the Online Store Conversion over time report for the last 90 days. Compare the listed percentage against the industry table to identify performance gaps.
Understanding Mobile vs. Desktop Behavior
Mobile users drive 65% to 75% of ecommerce traffic. Desktop users convert at double that pace. Mobile visitors convert between 1.5% and 2%, whereas desktop visitors convert between 3% and 4%.
Screen size influences average order value, though these figures vary widely by product category. Desktop orders average $146 to $204, while mobile orders hover near $137. Buyers experience friction during checkout, reducing mobile revenue. Customers abandon purchases because typing credit card numbers on small screens frustrates them.
Evaluate device performance inside the Shopify dashboard. Open the Sales by device report. Divide mobile orders by mobile sessions to find the mobile conversion rate. Repeat this calculation for desktop traffic. If mobile conversion falls below 1.5%, merchants must optimize the checkout flow. Adding accelerated payment methods like Shop Pay or Apple Pay removes checkout barriers.
Fixing the Privacy and Consent Gap in Analytics for Shopify Stores
Merchants tracking user behavior face strict legal restrictions in 2026. Regulators enforce the General Data Protection Regulation and the California Privacy Rights Act with multi-million dollar fines. Standard data collection methods violate these frameworks.
Why Native Consent Banners Fall Short
Shopify provides a default customer privacy banner displaying a cookie warning. This module fails to pause third-party scripts from loading. When visitors access the site, Meta Pixels and standard Google Analytics tags fire before the user interacts with the banner.
Merchants fail compliance checks under European and North American privacy laws when they fire scripts prior to explicit opt-in. Store owners must secure permission before gathering IP addresses and device identifiers. Displaying a passive notification at the bottom of the screen offers no legal protection against regulatory audits.
Audit the banner configuration by opening a fresh incognito browser window. Press F12 to load developer tools and click the Network tab. Type the store URL into the address bar and press enter. Watch the network requests before accepting the cookie popup. Search the list for terms like "collect", "pixel", or "analytics". Finding active network requests for external marketing tools means the store violates compliance rules.
The True Cost of Consent Mode v2
Advertising networks demand strict data handling rules. Google requires Consent Mode v2 for all merchants running European campaigns. This system adjusts tag behavior based on user consent choices.
When users reject privacy banners, Consent Mode stops reading or writing traditional tracking files. Google then calculates modeled data using machine learning algorithms. These modeled conversions lack precision. Merchants relying on client-side cookies combined with strict consent enforcement experience severe data drop-off. Store owners lose visibility into up to 30% of incoming traffic.
Check the volume of unknown traffic by reviewing the acquisition reports in the current analytics dashboard. Search for spikes in direct traffic or unassigned sessions. These unassigned metrics represent visitors rejecting tracking cookies.
Four Core Analytics Reports Merchants Must Track
Vanity metrics waste time. Measuring page views and bounce rates offers managers zero direction for budget allocation. Profitable operations track four specific behavioral patterns.
Implementing Funnel and Product Tracking
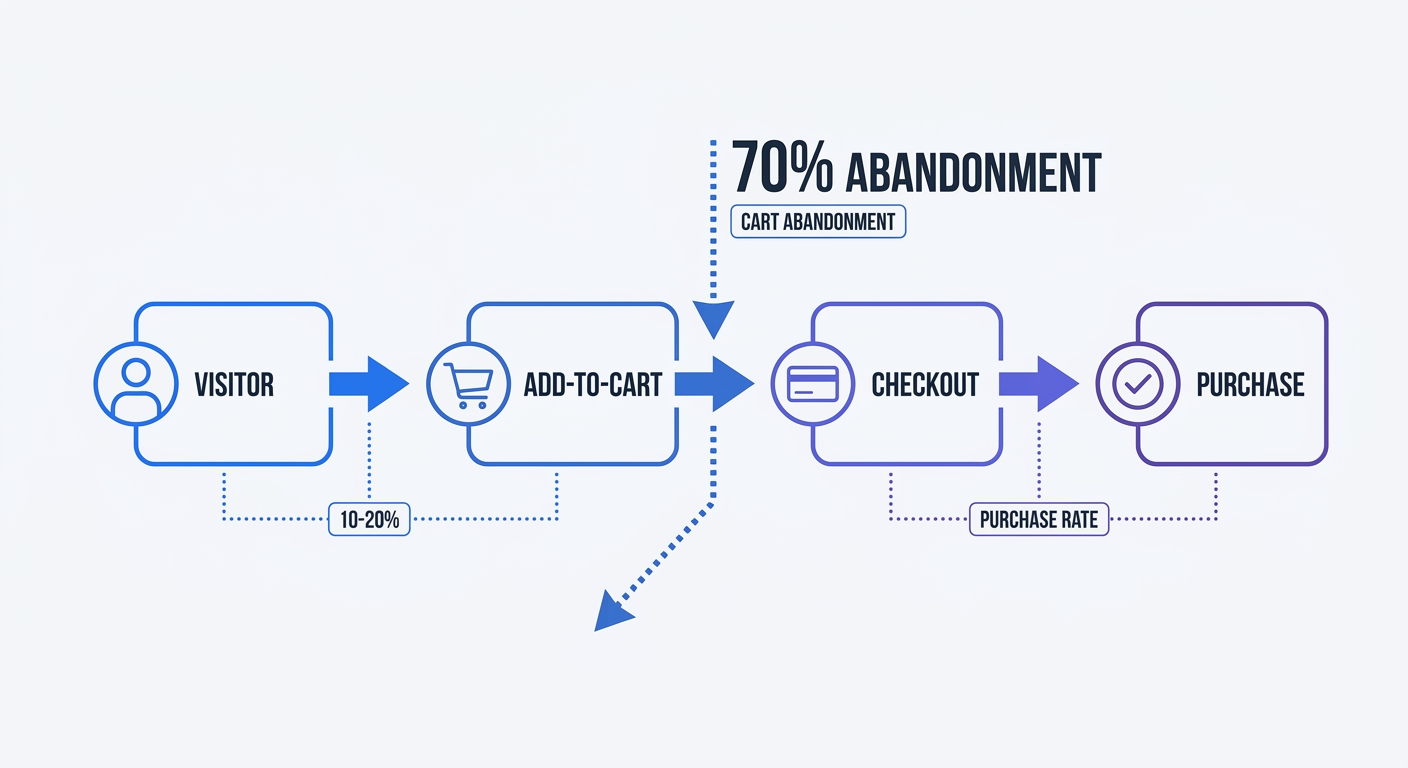
Analysts at the Baymard Institute confirm average shopping cart abandonment hits 70%, though typical rates fluctuate by industry. Visitors add items to their cart, enter shipping details, and disappear. Building a four-stage funnel isolates the precise moment buyers leave.
Build a custom funnel report inside the analytics dashboard. Define step one as a product page view and step two as an add-to-cart event. A healthy add-to-cart rate ranges from 10% to 20%. Step three logs the initiation of checkout, while step four records the final purchase confirmation. Pinpoint the stage with the steepest drop. High drop-off at the shipping stage signals unexpected delivery costs. Abandonment at the payment stage reveals a lack of trust or missing payment options.
Product reports help managers analyze inventory performance. Traffic volume and conversion rates fail to align across an entire catalog. Certain items generate massive interest but produce zero sales. Other products convert every fifth visitor but receive zero visibility.
Hunt for hidden product gems by exporting performance data into a spreadsheet. Add columns for traffic and conversion rates. Sort the conversion rate column from highest to lowest, then filter out any product with more than 500 monthly views. The remaining list exposes underperforming assets. These products convert at a high percentage but lack exposure. Move these items to the homepage or allocate specific ad spend to boost their visibility.
Calculating True Customer Acquisition Cost
Shopify tracks gross revenue and order volume, but the platform ignores external marketing expenses. Merchants must calculate their Customer Acquisition Cost by hand.
Divide total ad spend by the number of new customers acquired during a specific timeframe. For example, spending $2,000 on ads to acquire 100 new buyers creates a $20 acquisition cost.
Compare this cost against Customer Lifetime Value. Find this metric by multiplying average order value by average purchase frequency. An ideal ratio between lifetime value and acquisition cost hits 3:1. Earning $60 from a customer over their lifespan justifies a $20 acquisition cost.
Ratios of 1:1 mean the store loses money after accounting for product costs and shipping. A ratio of 6:1 means merchants under-spend on marketing. Increase ad budgets to capture more market share when the ratio climbs past the 3:1 threshold.
Making the Switch to Server-Side Analytics for Shopify Stores
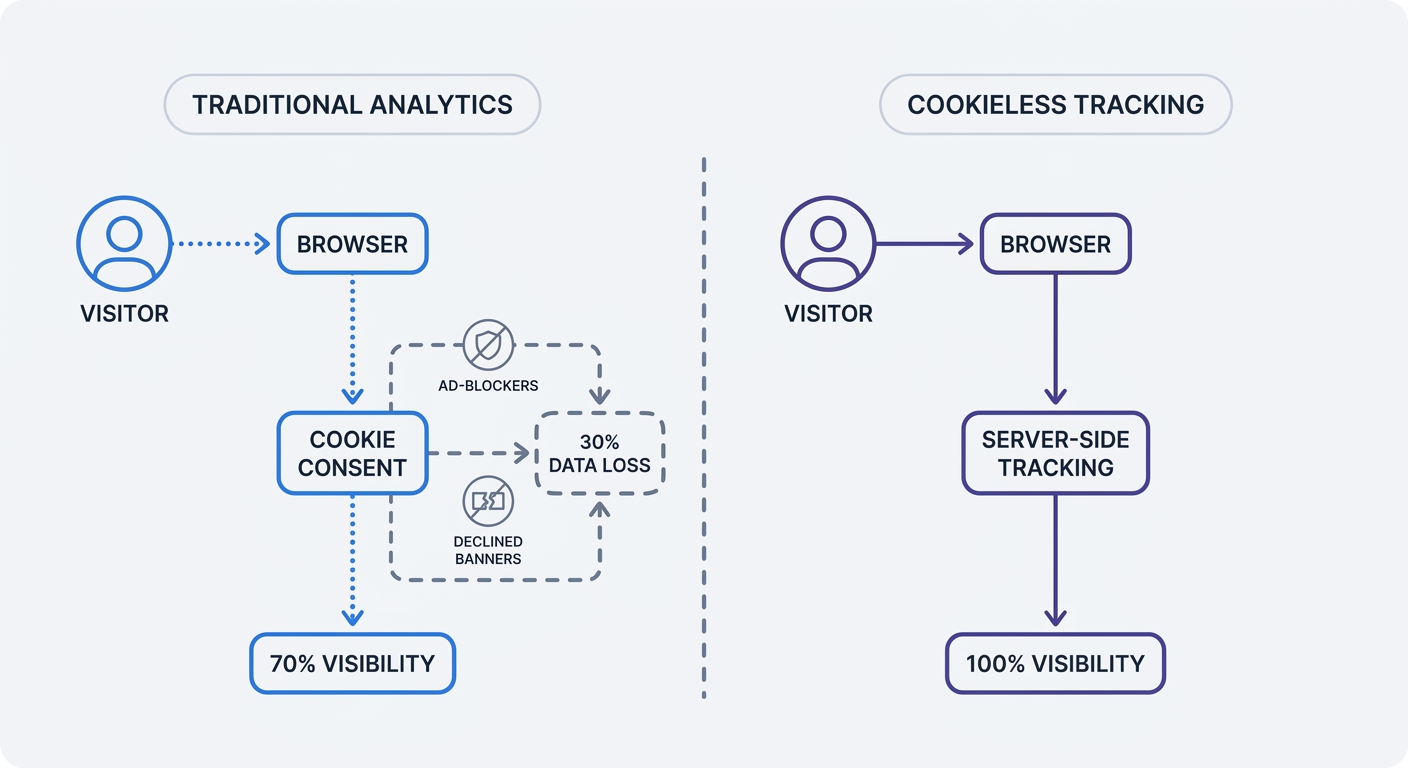
Traditional tracking architectures rely on client-side cookies. Browsers block these files, and ad blockers erase the data requests. Privacy laws restrict cookie usage. Moving to a server-side architecture solves these measurement barriers.
Reclaiming Traffic Visibility
Cookieless analytics platforms measure traffic without dropping persistent text files on visitor hard drives. Tools like Swetrix use aggregated data models. The tracking script hashes incoming request data, pairs it with a temporary daily salt, and discards the origin footprint.
This architecture avoids the consent gap. Analytics systems skipping the collection of Personally Identifiable Information remove the need for intrusive consent banners. Visitors land on the store, allowing the server to log the page view and traffic source. The visitor avoids tracking popups. The merchant retains 100% visibility into the session.
Ad blockers target client-side domains associated with advertising networks. Server-side tracking routes analytics data through a custom subdomain attached to the primary store URL. To an ad blocker, the analytics request mimics a standard first-party website function.
To set up a custom subdomain for analytics, create a DNS A-record pointing metrics.yourstore.com to the tracking server. Configure the tracking script to send data to this new subdomain. Ad blockers ignore this traffic, keeping the data flow uninterrupted.
The Ethical Analytics Advantage
Consumers distrust corporate data collection because massive breaches expose personal shopping habits and payment details. Building a tech stack around first-party data protects merchants from liability.
Ethical data practices create a distinct marketing asset. Update the store's privacy policy to state that the website uses cookie-free analytics. Explain that the company refuses to build, sell, or share personal profiles. Shoppers appreciate transparent data handling.
Integrate a privacy-first web analytics platform by following these steps:
- Open an account with a cookieless provider.
- Navigate to the Shopify theme code editor.
- Open the
theme.liquidfile. - Paste the tracking snippet before the closing
</head>tag. - Save the file and load the storefront to verify the connection.
Platforms built on open-source code offer additional security. Inspecting the source code guarantees the software performs as claimed. Swetrix provides an open-source Google Analytics alternative designed for privacy-conscious merchants.
Wholesale merchants on Shopify report a 96% year-over-year increase in B2B sales. Wholesale buyers exhibit distinct patterns. They revisit pages multiple times and download spec sheets before ordering. Standard cookie-based tracking fragments these long consideration cycles across multiple devices. Server-side tracking aggregates traffic trends, revealing the precise length of the B2B purchasing cycle.
Track specific user events to measure engagement. Configure the tracking snippet to log file downloads, video plays, or outbound link clicks. Open the analytics dashboard and navigate to the custom events tab. Group the events by path to identify which product videos drive the highest viewer engagement.
Monitor the returning customer rate. Direct-to-consumer brands retain 20% to 30% of their buyers on average, with consumable goods naturally seeing higher repeat purchase rates than durable items. Retention dropping below 15% signals product quality issues or poor post-purchase communication. Group retention metrics by traffic source. Compare organic search loyalty against paid social media campaigns. Reallocate the marketing budget to channels driving long-term retention.
Tracking acquisition cost per channel requires clean UTM parameters. Build unique tracking links for every campaign using a standardized naming convention. Paste the resulting links into Facebook Ads or Google Ads. The analytics platform reads these parameters, allowing the traffic report to attribute new visitors to the correct source.
Review the page speed impact. Client-side tracking scripts slow down rendering times. A one-second delay in page load reduces conversions. Native Shopify analytics deliver fast load times, meaning external tracking tools must match this speed. Cookieless tracking scripts weigh less than five kilobytes. The code executes without blocking the main browser thread. Implement error monitoring to catch broken scripts on the storefront.
Segment orders by visit count to calculate the percentage of revenue generated by first-time buyers versus returning visitors. Adjust the advertising strategy based on this data. When 80% of revenue comes on the first visit, merchants should allocate more budget to top-of-funnel acquisition. If most purchases happen on the third visit, increasing retargeting ad spend yields higher returns.
Stop losing attribution data to ad blockers and rejected privacy banners. Swetrix delivers complete traffic visibility for Shopify stores through privacy-compliant, server-side tracking. Start a free trial today to restore accurate measurement.