- Date
What Is Multi-Touch Attribution? A Complete Guide
 Andrii Romasiun
A customer sees your Instagram ad on Monday morning. They Google your brand Tuesday afternoon. Wednesday evening, they open your email newsletter. Thursday, they click a retargeting ad and convert. Five platforms claim credit for that sale. Instagram says the ad drove it. Google counts it as organic search. Your email tool marks it as an email conversion. The retargeting platform takes credit for the last click.
This attribution chaos costs you money. Without knowing which touchpoints drive conversions, you'll keep funding channels that look good in isolated reports but contribute nothing to the full journey. Multi-touch attribution solves this by tracking every interaction and distributing credit across the path to purchase.
What Is Multi-Touch Attribution?
Multi-touch attribution evaluates the impact of each marketing touchpoint in driving a conversion. Instead of crediting only the first or last interaction, MTA distributes conversion credit across the entire customer journey.
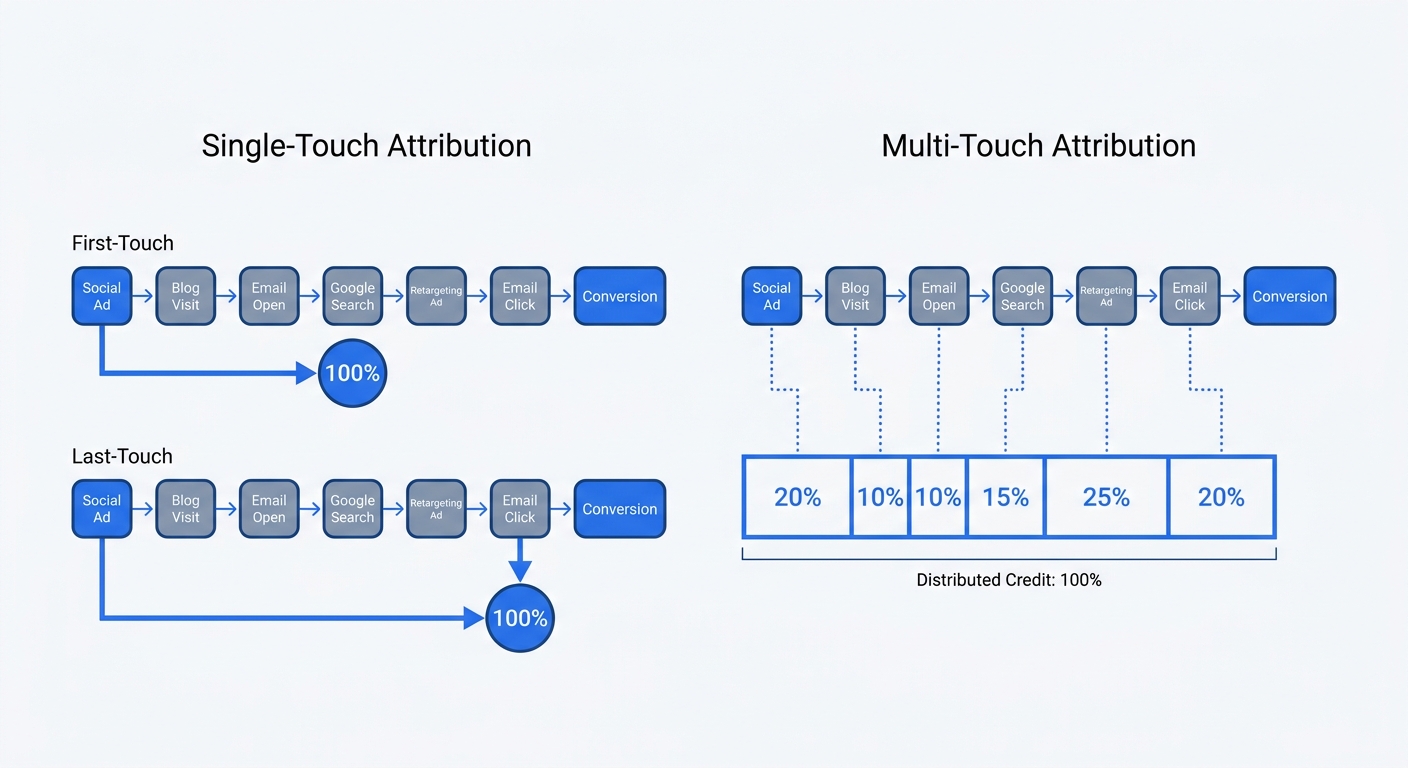
Customers engage 6 to 20 times before purchasing, according to recent industry analysis. A B2B software buyer might click a LinkedIn ad, read three blog posts, download a whitepaper, attend a webinar, and request a demo before signing a contract. Single-touch attribution assigns 100% credit to either the first touchpoint (the LinkedIn ad) or the last one (the demo request). Every interaction in between gets ignored.
Multi-touch attribution recognizes that the blog posts, whitepaper, and webinar all contributed to the decision. Each touchpoint receives a portion of the credit based on its role in the conversion path.
The Problem Multi-Touch Attribution Solves
Platform-level reporting creates false winners. Facebook Ads Manager shows 500 conversions. Google Ads reports 450. Your email platform claims 300. Add them up and you've generated 1,250 conversions, but your sales total 400. Each platform uses last-click attribution and claims full credit for conversions it only partially influenced.
This overlap means you can't trust any single platform's conversion count. A Salesforce study found that consumers engage with brands three or more times before purchasing, and high-income buyers exceed five touchpoints. Without MTA, you're blind to which combinations of touchpoints work.
How MTA Differs from Single-Touch Attribution
Single-touch models assign 100% credit to one interaction. First-touch attribution credits the initial touchpoint, useful for measuring brand awareness campaigns but useless for understanding what closes deals. Last-touch attribution credits the final interaction before conversion, helpful for direct response metrics but ignores everything that built interest.
Multi-touch models distribute credit across multiple touchpoints using predefined rules or machine learning algorithms. A customer journey with six touchpoints might split credit 20-15-15-15-15-20 under a U-shaped model, or 16.7% to each touchpoint under a linear model. The specific distribution depends on which attribution model you choose.
Why Multi-Touch Attribution Matters in 2026
Market Adoption and Growth
75% of companies now use a multi-touch attribution model to measure marketing performance. The MTA market reached $2.76 billion in 2026, growing from $2.43 billion in 2025, with projections showing $5.17 billion by 2031 at a 13.41% compound annual growth rate .
This isn't experimental technology anymore. More than 52% of marketers use multi-touch attribution models, and 76% of all marketers report having or planning to implement attribution capability within 12 months.
ROI and Performance Impact
Attribution delivers measurable results. Nielsen proved a 9.7% conversion increase and 27% conversion rate improvement in automotive campaigns using multi-touch models . Companies report ROI improvements reaching 30% after implementing proper attribution.
The financial impact extends beyond conversion rates. Attribution now guides 47% of digital spend decisions in retail, finance, and technology industries. When you know which channel combinations drive revenue, budget allocation becomes data-driven rather than guesswork.
Check your current attribution setup. If you're using platform-level last-click reporting, you're overinvesting in bottom-funnel channels and starving the awareness and consideration touchpoints that make those conversions possible.
The Privacy and Cookie Deprecation Challenge
Third-party cookies faced planned deprecation, though Google reversed course in July 2024 and now offers users choice rather than forced elimination. By September 2025, GDPR fines across 2,590 cases surpassed €6 billion . California imposed its largest CCPA settlement in July 2025 at $1.55 million.
The proportion of brands growing their first-party datasets nearly doubled from 41% in 2022 to 71% by 2024, and 84% of marketers now use first-party data as a primary source. Cookie-based attribution models lost significant fidelity. Cross-site identity disappeared. Multi-device stitching weakened. Deduplication across channels became unreliable.
MTA still works in this environment, but only after rebuilding on first-party data and privacy-first infrastructure. The companies adapting fastest are those treating privacy compliance as a competitive advantage rather than a regulatory burden.
The 6 Main Multi-Touch Attribution Models
Rule-Based Models (Linear, Time Decay, Position-Based)
Linear attribution distributes equal credit to all touchpoints in the customer journey. A conversion path with five interactions gives each touchpoint 20% credit. Marketers use this model for long consideration cycles where every touchpoint contributes roughly equally to the decision.
Use linear attribution when you lack historical data to weight touchpoints differently or when your sales cycle spans months with many research-oriented interactions. The model works well for B2B companies where prospects engage with multiple content pieces before requesting demos.
Time decay attribution assigns more credit to recent touchpoints. The percentage of credit builds while leading up to the last interaction. A customer who clicked an ad 30 days ago, read a blog post 15 days ago, and opened an email yesterday might see credit distributed 10-30-60 across those three touchpoints.
This model suits short consideration cycles and promotional campaigns where recent interactions carry more conversion intent than early awareness touches. E-commerce flash sales and limited-time offers benefit from time decay because the final touchpoints trigger purchase urgency.
U-shaped (position-based) attribution gives 40% credit to the first touchpoint, 40% to the conversion touchpoint, and splits the remaining 20% among middle interactions. This model emphasizes how customers enter your funnel and what closes them.
Position-based attribution works when you want to credit both awareness-building and conversion-driving activities. A SaaS company might use this to value both the initial content download that introduced the prospect and the demo that sealed the deal.
Advanced Models (W-Shaped, Algorithmic/Data-Driven)
W-shaped attribution extends the U-shaped model by adding emphasis on the lead creation touchpoint. The first interaction, lead creation moment, and final conversion each receive 30% credit, with the remaining 10% divided across other touchpoints.
This model suits businesses with distinct lead qualification stages. If your funnel includes a clear moment when prospects become marketing-qualified leads, like filling out a detailed form or requesting pricing, W-shaped attribution captures the importance of that middle conversion.
Algorithmic (data-driven) attribution uses machine learning to analyze historical conversion data and assign credit based on each touchpoint's contribution. These frameworks controlled 34.25% market share in 2025 and will expand at 14.05% CAGR through 2031 , marking the shift from rule-based to machine-learning approaches.
Data-driven models require substantial conversion volume, typically hundreds of conversions per month, to train algorithms effectively. The model identifies patterns humans miss, like discovering that blog readers who also watch product videos convert at 3x the rate of those who only read blogs.
Which Model Should You Choose?
Start with your sales cycle length. Short cycles (under 7 days) benefit from time decay. Long cycles (over 30 days) work better with linear or position-based models. Mid-length cycles with clear lead qualification stages suit W-shaped attribution.
Consider your data maturity. Companies new to attribution should begin with linear or U-shaped models. These frameworks provide immediate insights without requiring machine learning expertise. After six months of data collection, evaluate whether patterns justify moving to algorithmic attribution.
Match model complexity to team sophistication. A three-person marketing team lacks bandwidth to maintain data-driven models. A 20-person team with dedicated analysts can use algorithmic approaches. Around 52% of current tools incorporate predictive AI capabilities, but using them effectively requires technical skill.
Test multiple models in parallel for three months. Compare how each model distributes credit across your conversion paths. The model that aligns closest with your intuition about which channels drive results while revealing non-obvious patterns is your starting point.

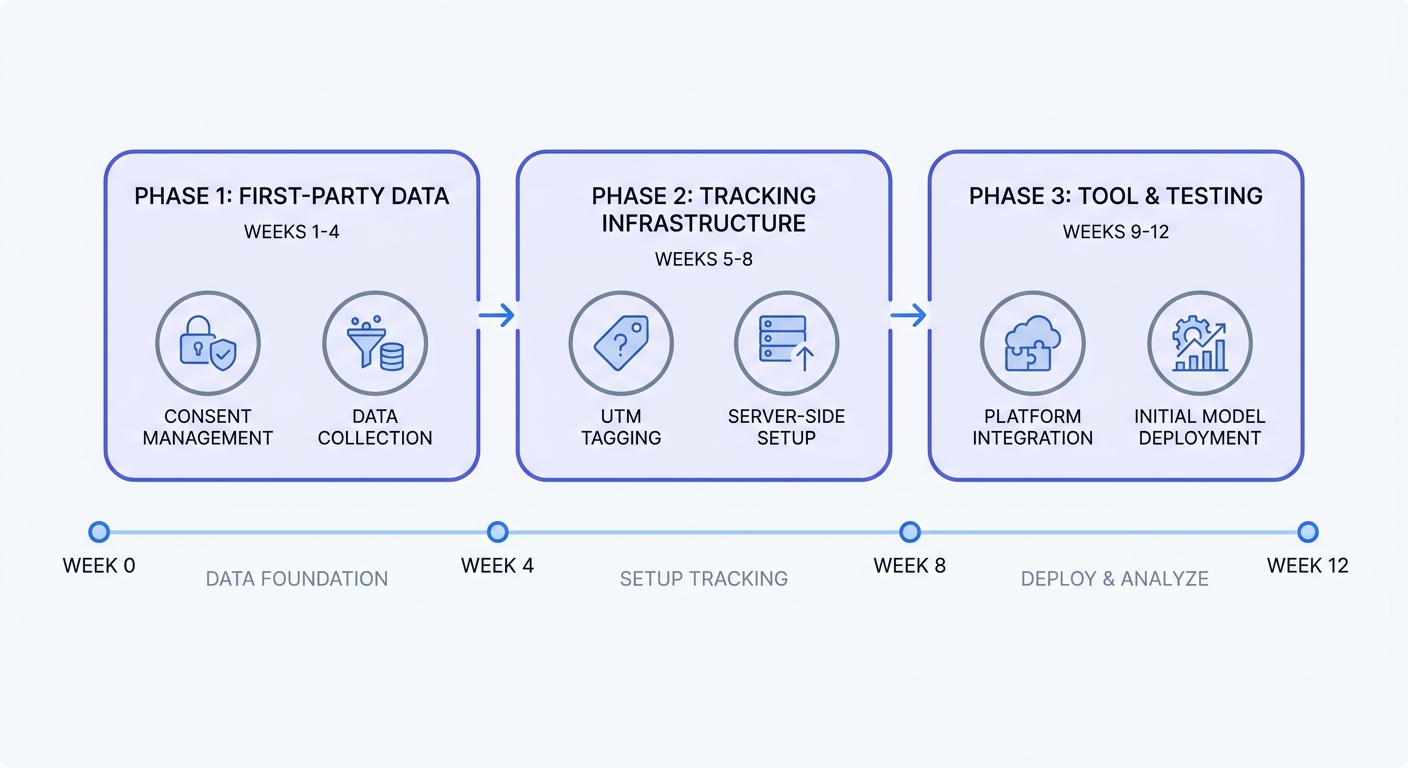
How to Implement Multi-Touch Attribution (Privacy-First Approach)
Step 1: Build Your First-Party Data Foundation
Collect first-party data across every customer touchpoint. Email signups, purchase history, on-site behavior, loyalty program participation, and progressive profiling create the dataset that powers privacy-compliant attribution.
Implement clear consent mechanisms at each data collection point. GDPR and CCPA require explicit user permission before tracking behavior. A consent management platform handles this, but even basic implementations need visible opt-in checkboxes with plain-language explanations of what data you collect and why.
Connect your data sources into a unified customer profile. CRM data, website analytics, email engagement metrics, and transaction records must link to the same customer ID. Without this connection, a customer's email click and website visit appear as separate users rather than one journey.
Audit your current data collection. List every form, tracking pixel, and integration that captures customer information. Identify gaps where customer actions go untracked, like phone calls, in-store visits, or chat conversations, and add tracking for those touchpoints.
Step 2: Set Up Proper Tracking and Tagging
Tag every marketing link with UTM parameters. Append ?utm_source=facebook&utm_medium=cpc&utm_campaign=spring_sale to ad URLs. Email links need tags. Social media posts need tags. Partner referrals need tags. Consistent tagging separates paid social from organic social, email clicks from direct traffic, and campaign A from campaign B in your reports.
Standardize your naming conventions before launching campaigns. Create a shared spreadsheet with approved values for source, medium, campaign, term, and content parameters. "facebook" and "Facebook" create separate rows in reports. "email" and "email-newsletter" split your email data. Consistency matters more than the specific names you choose.
Implement server-side tracking to recover lost conversion signals. Server-side tracking recovers 15-30% of lost conversion data by sending events from your server to analytics platforms, bypassing browser-based ad blockers and privacy restrictions. Google Tag Manager's server-side container handles this for most platforms.
Set up event tracking for key actions beyond pageviews. Track form submissions, video plays, file downloads, button clicks, and scroll depth. These micro-conversions reveal engagement patterns that predict macro-conversions. A visitor who watches three product videos shows higher intent than someone who bounces after one page.
Step 3: Choose Privacy-Compliant Tools
Evaluate analytics platforms based on privacy compliance, not features. Tools like Matomo, Fathom, and Simple Analytics offer cookieless tracking by default while providing robust insights on user behavior, traffic sources, bounce rates, and conversions.
Swetrix provides GDPR-compliant analytics without cookies, giving you accurate attribution data while respecting user privacy. The platform tracks conversions and traffic sources using privacy-first methods that work across browsers and devices without third-party cookies.
Traditional attribution solutions cost $1,500-2,000 per month for full visitor-level tracking, leaving small businesses unable to afford proper attribution. Privacy-first platforms charge a fraction of that while delivering comparable insights for most use cases.
Test your chosen platform with a small campaign before full deployment. Run parallel tracking with your existing analytics for two weeks. Compare conversion counts, source attribution, and user journey data. Discrepancies over 10% indicate tracking gaps that need fixing before you rely on the new platform for budget decisions.
Common Multi-Touch Attribution Challenges and Solutions
Data Quality and Integration Issues
Discrepancies and measurement gaps rank as the biggest attribution hurdles. Marketing platforms use different conversion windows, attribution models, and tracking methods. Facebook counts a conversion if someone clicks an ad and purchases within 7 days. Google Ads uses a 30-day window. Your email platform might use 14 days.
These inconsistent windows create overlapping conversion claims. One sale generates three "conversions" across three platforms, each using different lookback periods. Standardize conversion windows across all platforms to 30 days, or pick the window that matches your sales cycle.
Invest in robust data integration. Marketing automation platforms, CRM systems, analytics tools, and ad platforms must share data through APIs or data warehouses. Manual CSV exports create version control problems and delay insights by days or weeks.
Clean your data before analyzing it. Remove bot traffic, filter internal team visits, deduplicate records with slight variations in customer identifiers, and standardize location data that appears as "New York," "NY," and "New York City" in different systems.
Cross-Device and Identity Resolution
Customers click ads on mobile, research on laptops, and convert on tablets. Without strong identity resolution, these multi-device journeys look like separate users. A customer who interacts on three devices appears as three different people, fragmenting the attribution data.
Implement authenticated tracking wherever possible. Require login for key actions like adding items to cart, saving favorites, or accessing gated content. Once authenticated, you can connect all of a customer's devices to a single profile.
Use probabilistic matching for anonymous visitors. Device fingerprinting, IP addresses, and behavioral patterns help link sessions across devices with 70-85% accuracy. This isn't perfect, but it recovers attribution data that would otherwise remain fragmented.
Data clean rooms provide privacy-safe identity resolution. These secure environments let you match first-party data with partner data without exposing individual user information. 87% of companies expected to increase clean room use in 2024, making this approach standard for cross-device attribution.
Offline Touchpoint Tracking
MTA measures digital actions like clicks, making it challenging to incorporate offline data such as TV ads, print campaigns, direct mail, or in-store visits. A customer might see a billboard, hear a radio ad, and visit your store before searching your brand online and converting.
Bridge offline and online data with unique identifiers. Give each direct mail piece a unique URL or QR code. Track which codes get scanned and connect those sessions to subsequent conversions. Phone numbers on print ads can use call tracking software that assigns unique numbers to each campaign.
Combine MTA with Marketing Mix Modeling (MMM) for offline channels. MMM uses aggregate data and statistical analysis to measure how offline media spending correlates with sales. While MTA tracks individual journeys, MMM captures the incremental lift from TV, radio, and print at the campaign level.
Survey customers about how they heard about you. Post-purchase surveys asking "How did you first hear about us?" provide directional data on offline touchpoint effectiveness. This self-reported data has bias, but it fills gaps that digital tracking can't reach.
Best Practices for Multi-Touch Attribution Success
Start Simple, Then Evolve
Begin with a straightforward model before implementing complex approaches. Linear or U-shaped attribution provides immediate value without requiring machine learning expertise or massive conversion volumes. These models work with dozens of conversions per month, not the hundreds needed for algorithmic approaches.
Run your model for at least three months before adding complexity. This baseline period reveals which channels appear in conversion paths, what your average journey length looks like, and where obvious optimization opportunities exist.
Document your model assumptions and review them quarterly. Business changes like new products, different target audiences, and seasonal patterns can make your initial model less accurate over time. A quarterly review catches these shifts before they corrupt your attribution data.
Evolve toward data-driven models once you have sufficient conversion volume and technical capability. Algorithmic attribution requires buy-in from multiple parties and talent to deploy the models, but it reveals patterns that rule-based models miss.
Combine Multiple Measurement Approaches
Use MTA for granular insights into individual customer journeys. Track which specific touchpoint sequences convert best, identify high-performing content pieces, and optimize channel mix at the campaign level.
Add Marketing Mix Modeling for strategic allocation decisions. MMM measures the incremental impact of overall channel spending on revenue, helping you decide whether to shift budget from paid search to paid social at the portfolio level.
Validate findings with incrementality testing. Run holdout tests where you stop spending on a channel for a control group and measure the sales impact. The best marketers use a mix of MTA, MMM, and experiments to keep their attribution honest.
Cross-reference attribution data with customer feedback. Surveys, sales call notes, and support conversations reveal why customers convert. A channel might show low attribution credit but introduce customers to your brand, making it valuable despite poor last-click performance.
Review and Optimize Quarterly
Examine your attribution model at least every three months. Any significant business shift should trigger an immediate review to ensure your model continues to reflect reality. New product launches, pricing changes, competitive moves, and seasonal patterns all affect which touchpoints drive conversions.
Compare attributed conversions to revenue. If your attribution model credits channels with 1,000 conversions but your sales team closed 800 deals, investigate the 200-conversion gap. Misaligned conversion definitions, tracking errors, or model assumptions might be inflating your numbers.
Test model changes on historical data before implementing them. If you're considering switching from linear to time decay attribution, apply both models to the past quarter's data and compare results. Large discrepancies in channel credit reveal how the change will affect budget allocation decisions.
Track attribution model confidence over time. As you collect more data, your model's predictions should become more accurate. If confidence isn't improving after six months, your tracking setup has gaps or your model doesn't fit your business reality.
Multi-touch attribution transforms marketing from guesswork into science, but only when built on privacy-first infrastructure and first-party data. The companies winning in 2026 are those that adapted early to cookieless tracking and GDPR compliance.
Start tracking your customer journeys with Swetrix's privacy-first analytics. No cookies, no compliance headaches, accurate attribution data that respects user privacy. Try it free for 14 days.