- Date
Website Heatmap Alternatives: Privacy-First Tools for 2026
 Andrii Romasiun
A visitor lands on your checkout page, hovers over the "Complete Purchase" button for three seconds, then closes the tab. Your traditional heatmap shows a red cluster on that button—plenty of clicks—but it can't tell you why this particular user hesitated or what happened in the thirty seconds before they left.
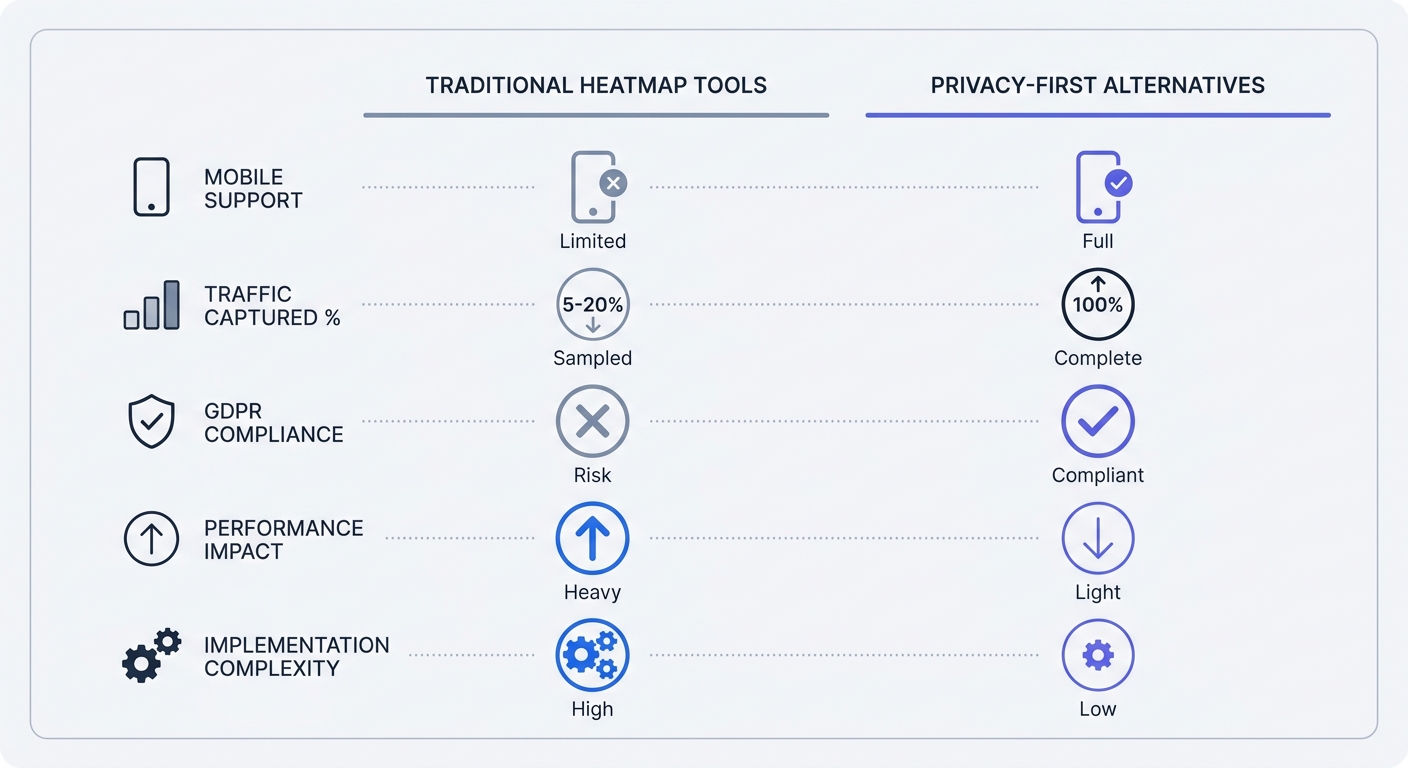
Traditional heatmaps aggregate thousands of sessions into color-coded overlays. They show where users click, but they flatten individual journeys into statistical averages. When mobile devices account for over 60% of global website traffic and privacy regulations cause significant data loss when visitors decline tracking, those colorful maps represent a fraction of your actual audience.
Privacy-first analytics tools capture the full picture without consent banners, cookies, or personally identifiable information. These alternatives record every visitor, track complete user journeys, and comply with GDPR by design. Switch to cookieless tracking, and your traffic numbers can increase substantially overnight—not because you gained new visitors, but because you're seeing the ones who were always there.
Why Traditional Heatmaps Fall Short in 2026
The Mobile Blindspot Problem
Most heatmap tools were built for desktop screens. They overlay click coordinates on a fixed canvas, assuming every visitor sees the same layout. Mobile users scroll differently, tap with varying precision, and interact with responsive elements that shift position based on screen size.
Sixty percent of all website traffic now comes from mobile devices, yet many legacy heatmap platforms don't support mobile app tracking or responsive web heatmaps. The data gap is worse than it appears: mobile users behave differently from desktop users. They scroll 1.5x faster, abandon forms at higher rates, and convert through different paths. A heatmap that only captures desktop sessions misses the majority user experience.
Check your current tool's mobile support by opening your heatmap dashboard and filtering for mobile sessions. If the option doesn't exist or shows fewer than 50% of total traffic, your tool has a mobile blindspot. Compare your analytics platform's mobile traffic percentage against your heatmap tool's mobile session count. A 20-point gap means you're optimizing for the wrong audience.
Privacy Regulations Changed Everything
GDPR requires explicit consent before storing or retrieving data from a visitor's device. Traditional heatmap tools use cookies to track sessions across pages, triggering consent banner requirements. When visitors see "Accept Cookies" or "Reject All," a significant portion decline consent, and those sessions vanish from your analytics.
EU data protection authorities have indicated that privacy-first analytics tools—those that collect no personally identifiable information and use no cookies—may be considered exempt from consent requirements if configured to collect only aggregate, non-identifying data and operated in accordance with relevant Data Protection Authority (DPA) guidance and national law. However, interpretations vary across EU member states, and site operators should verify their tool's settings and consult local DPA guidance or legal counsel to confirm compliance. When configured correctly to collect only aggregate data without tracking individuals, consent banners may not be required.
Run this audit on your current setup: Open your site in an incognito window, reject all cookies, then visit three pages. Check your analytics dashboard. If those pageviews don't appear, you're losing substantial traffic data to consent rejections. Privacy-first tools capture those sessions because they never required consent in the first place.
The Traffic Gap
Businesses switching to cookieless analytics report seeing substantially more traffic than Google Analytics showed. The difference isn't new visitors—it's the existing visitors who declined cookie consent and were never counted.
Traditional analytics platforms send a JavaScript tag to the visitor's browser, set cookies, and transmit data back to a third-party server. Browser privacy features, ad blockers, and consent rejections block this process at multiple points. A single Firefox user with Enhanced Tracking Protection enabled blocks the entire tracking chain by default.
Calculate your own traffic gap by comparing your server logs to your analytics platform for the same 24-hour period. Server logs record every HTTP request regardless of cookies or JavaScript. If your analytics shows 10,000 sessions but your server logs show 18,000 unique IPs, the 8,000-visitor difference represents your blind spot. Privacy-first tools close this gap by using server-side tracking that bypasses browser restrictions.
Privacy-First Analytics: The Complete Alternative
How Cookie-Free Tracking Works
Cookie-free analytics platforms collect data without storing identifiers in the visitor's browser. Instead of setting a cookie with a unique session ID, they generate a temporary hash from the visitor's IP address, user agent string, and timestamp. This hash exists only in server memory for the duration of the session and gets discarded after 30 minutes of inactivity.
The hash can't identify an individual across sessions or link behavior to a real person. It serves one purpose: grouping pageviews from the same visit into a single session for that day's report. Tomorrow, the same visitor generates a different hash, appearing as a new session. This approach counts traffic without tracking individuals over time.
Plausible Analytics uses a 2.5KB script compared to Google Analytics 4's 135KB payload. The smaller script loads faster, consumes less bandwidth, and reduces your site's carbon footprint. It doesn't set cookies, doesn't collect personal data, and doesn't require a consent banner under GDPR.
Check if a tool is privacy-first using this four-point test: Open the browser's developer console, load your site, and inspect the Network tab. Look for cookie-setting requests (Set-Cookie headers). Check the Application tab for stored cookies. Verify the script size under Network. Confirm the data endpoint—it should point to a first-party domain or EU-based server, not a third-party tracking domain.
Server-Side vs Client-Side: What You Need to Know
Client-side tracking runs JavaScript in the visitor's browser. The script captures events, stores data in cookies, and sends it to an analytics server. This architecture gives visitors full control—they can block scripts, delete cookies, or reject consent—but it also makes tracking fragile and incomplete.
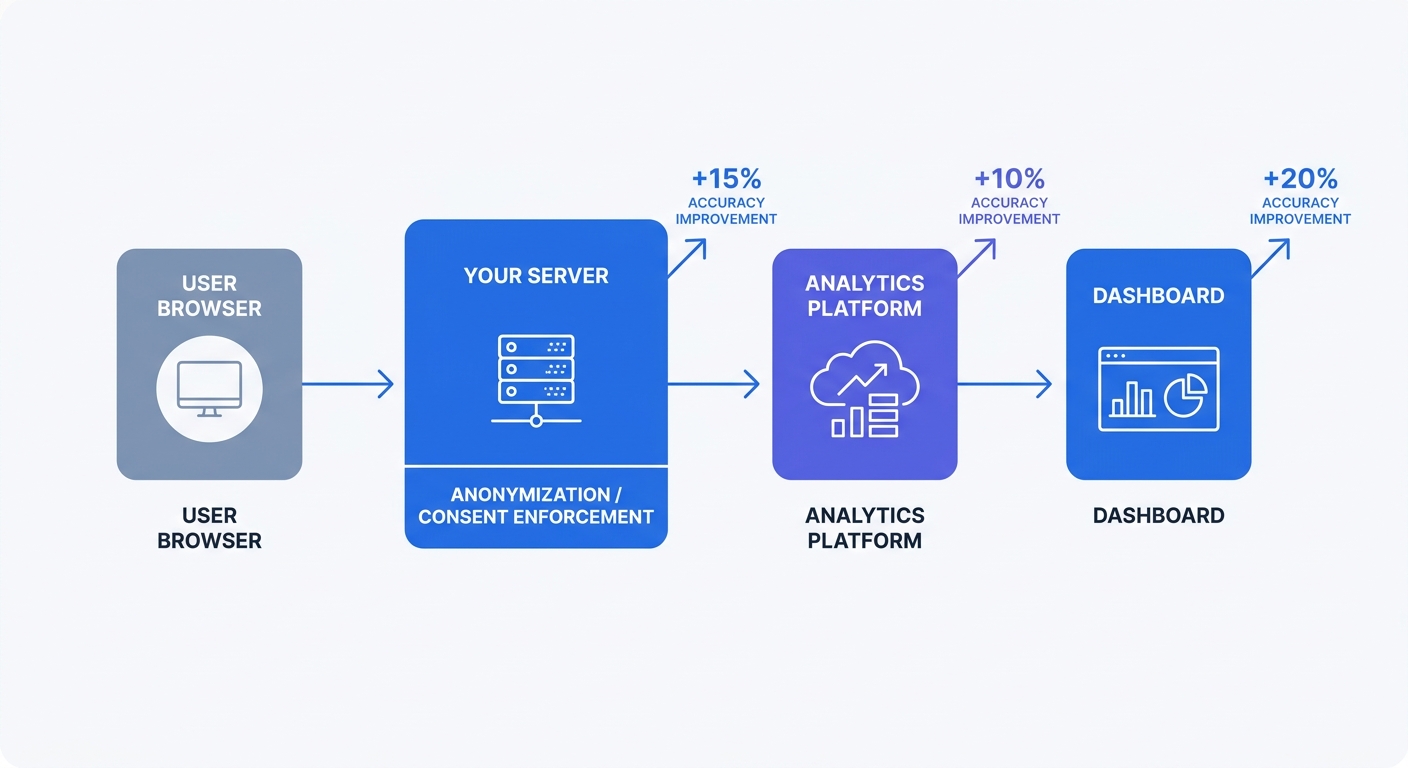
Server-side tracking moves data collection to your web server. When a visitor requests a page, your server logs the request, extracts relevant data (URL, referrer, timestamp), anonymizes the IP address, and forwards the processed data to your analytics platform. The visitor's browser never runs tracking code, so ad blockers and privacy tools can't interfere.
Organizations using server-side tracking report data accuracy improvements reaching 95-100% compared to 70-80% with client-side-only setups. The architecture centralizes consent enforcement—your server checks consent status before forwarding data—and enables real-time anonymization before any data leaves your infrastructure.
Implement server-side tracking by adding a lightweight proxy between your web server and analytics platform. Tools like Swetrix support server-side collection through a simple API endpoint. Configure your web server to POST anonymized request data to https://api.swetrix.com/log with parameters for path, referrer, and user agent. The platform processes the data and updates your dashboard without touching the visitor's browser.
Why EU Authorities Approve These Tools
Multiple EU data protection authorities, including France's CNIL and Germany's DSK, have indicated that privacy-first analytics tools may be considered exempt from consent requirements when configured correctly. The potential exemption may apply when the tool collects no personally identifiable information, uses no cookies, anonymizes IP addresses, and stores data on EU servers—though interpretations and requirements can vary by jurisdiction and may change as regulatory positions evolve.
GDPR's recital 30 states that data processing for statistical purposes doesn't require consent if the data cannot identify individuals. Privacy-first tools can meet this standard by design when they aggregate traffic patterns without tracking individual users across sessions or sites. However, site operators should verify their specific configuration meets local DPA requirements and consider consulting legal counsel for their jurisdiction.
Verify compliance with this checklist: Confirm the tool doesn't use cookies (check browser dev tools). Verify IP anonymization happens before storage (check the tool's documentation for their anonymization method—truncating the last octet is insufficient; full hashing is required). Ensure data stays in the EU (check the tool's server locations). Confirm no cross-site tracking (the tool should only track your domain, not follow users across the web). Consult relevant DPA guidance or legal counsel to confirm the tool configuration meets requirements in your specific jurisdiction.
Session Replay: See the Full User Journey
What Session Replay Captures That Heatmaps Miss
Heatmaps show aggregate click patterns across thousands of sessions. Session replay records individual user journeys from landing to exit. Watch a replay, and you see where a user hesitated, which form field caused confusion, or what error message triggered abandonment.
A heatmap might show 200 clicks on your "Add to Cart" button with a 15% conversion rate. Session replay reveals that 85% of non-converters clicked the button, saw a loading spinner for three seconds, then closed the tab because the product never added to their cart. The heatmap showed engagement; the replay showed a broken interaction.
Session replay tools record DOM changes, mouse movements, clicks, scrolls, and form interactions. They reconstruct the session as a video-like playback, but they're not recording video—they're logging events and replaying them in a simulated browser. This approach keeps file sizes small (50-100KB per session) and enables privacy controls like field masking.
Privacy-Safe Session Recording
Session replay raises obvious privacy concerns. Recording every keystroke and mouse movement could capture passwords, credit card numbers, or personal information. Privacy-safe replay tools address this through automatic field masking, IP anonymization, and consent controls.
Field masking blocks sensitive form inputs before recording. Configure your replay tool to mask any field with type="password", autocomplete="cc-number", or class names like sensitive or private. The replay shows that a user typed in the field, but the characters appear as asterisks or are omitted.
IP anonymization hashes the visitor's IP address before storage. The replay tool can still group sessions from the same visitor during a single day, but it can't link sessions across days or identify the visitor's location beyond country-level. Set data retention to 30 days maximum—long enough to analyze recent behavior, short enough to minimize privacy risk.
Implement consent controls through your existing consent management platform. If a visitor rejects analytics cookies, disable session replay for that session. Most replay tools offer a disableRecording() API method that stops collection. Call this method when consent is denied, and the tool won't capture any data from that visitor.
Top Tools Compared
LogRocket, FullStory, and Microsoft Clarity represent three different approaches to session replay. LogRocket focuses on error tracking, linking each replay to JavaScript errors and network failures. FullStory emphasizes behavioral analysis with advanced search filters for finding specific user actions. Clarity is free with no traffic caps, making it the best starting point for budget-conscious teams.
LogRocket costs $99/month for 10,000 sessions and includes error tracking, performance monitoring, and Redux/Vuex state inspection. Use it when debugging complex JavaScript applications where you need to see both the user's actions and the underlying code state.
FullStory starts at $199/month for 50,000 sessions and offers powerful search capabilities. Filter replays by "users who clicked the checkout button but didn't complete purchase" or "mobile users who scrolled past the fold on the pricing page." Use it when you need to analyze patterns across thousands of sessions.
Microsoft Clarity is free with no session limits, no traffic restrictions, and no credit card required. It includes heatmaps, session recordings, and basic filtering. Start here if you're implementing session replay for the first time or working with limited budget.
Set up session replay in three steps: Choose a tool based on your primary use case (debugging, behavioral analysis, or budget constraints). Configure privacy settings by enabling field masking for password and payment fields, setting IP anonymization to full hash mode, and limiting data retention to 30 days. Set up alerts for friction points by creating filters for rage clicks (multiple rapid clicks on the same element), error clicks (clicks that trigger JavaScript errors), and dead clicks (clicks on non-interactive elements).
Form Analytics and Funnel Analysis
Track Drop-Offs at Every Step
Form analytics shows where users abandon forms and why. Traditional analytics reports "50 form submissions" but doesn't explain why 200 users started the form and only 50 completed it. Form analytics tracks every field interaction: time spent per field, fields left blank, fields corrected multiple times, and the exact field where users abandoned.
A checkout form might show these metrics: 1,000 users reached the form, 800 entered their email, 600 entered their address, 400 entered payment details, and 300 completed purchase. The 400-to-300 drop between payment entry and completion suggests a problem with the final "Place Order" button—maybe it's unclear, maybe the shipping cost surprises users at the last step, or maybe the button doesn't provide feedback when clicked.
Track form abandonment by instrumenting each field with event tracking. Fire an event when a user focuses on a field, another when they blur (leave) the field, and a third when they submit the form. Calculate abandonment rate per field: (users who focused on field N) minus (users who focused on field N+1) divided by (users who focused on field N). A 40% drop between fields indicates a problem with that specific field.
Form Field Analytics Without PII
Form analytics can capture interaction patterns without recording the data users enter. Track field focus time, correction count, and completion status, but don't log the field values themselves. This approach shows that users spent 45 seconds on the "Phone Number" field and corrected it three times, suggesting the field validation is too strict or the format requirements are unclear.
Implement privacy-safe form tracking by adding event listeners to form fields that fire on focus, blur, and submit events. Send these events to your analytics platform with metadata: field name (not value), timestamp, and action type. Never include the field's content in the event payload.
Configure field-level tracking for multi-step forms by assigning each step a unique identifier. Track progression through steps, time spent per step, and abandonment rate per step. A three-step checkout might show 80% completion on step one, 60% on step two, and 40% on step three, indicating step two needs optimization.
Combining Multiple Data Sources
Combining heatmaps with session replay and form analytics provides a complete view of user behavior. Heatmaps show where users click, session replay shows why they clicked there, and form analytics shows what happened after the click.
A heatmap might show heavy clicking on your pricing table's "Enterprise" tier. Session replay reveals that users click the tier, scroll down looking for a "Contact Sales" button, don't find it, then leave. Form analytics shows that users who do find the contact form abandon it at the "Company Size" field. Each tool answers a different question, and together they reveal the complete problem: users want to contact sales, the CTA is hard to find, and the form asks for information too early in the relationship.
Build a conversion funnel map with five key stages: landing (user arrives from any source), engagement (user scrolls past fold or clicks any element), form start (user focuses on first form field), form completion (user submits form), and conversion (user completes purchase or signup). Set baseline metrics for each stage using your current analytics data, then track week-over-week changes as you implement optimizations.
On-Page Surveys and Feedback Tools
Ask Users What They Need
Behavioral data shows what users do. Surveys show why they do it. A user might abandon your checkout after entering payment details. Session replay shows they clicked the "Place Order" button three times with no visible response. A survey asking "What stopped you from completing your purchase?" reveals that the button appeared broken because the loading spinner didn't appear until two seconds after the click.
On-page surveys appear as small widgets that slide in from the corner or appear as modal overlays. Keep surveys short—three questions maximum—and trigger them at specific moments: after a user spends 30 seconds on a page, after they scroll to the bottom, or after they attempt to exit.
Implement surveys without tracking cookies by using session-based display logic. Show the survey once per session using sessionStorage (which clears when the browser closes) instead of cookies (which persist across sessions). This approach respects privacy while preventing survey fatigue.
Privacy-Compliant Survey Implementation
Survey tools collect user-provided data, which requires different privacy considerations than behavioral analytics. Users volunteer feedback, but you still need to handle that data responsibly. Don't require email addresses unless you plan to follow up. Don't link survey responses to individual user sessions. Aggregate responses and analyze patterns, not individual submissions.
Configure survey privacy by disabling IP logging, setting response retention to 90 days, and anonymizing free-text responses before analysis. If a user writes "I couldn't complete checkout because my credit card ending in 1234 was declined," redact the card number before storing the response.
Set up GDPR-compliant surveys by adding a consent checkbox for users who provide email addresses: "I agree to be contacted about my feedback." Make this checkbox optional and separate from the survey submission button. Users can submit anonymous feedback without providing contact information.
When to Use Surveys vs Behavioral Data
Use behavioral data to identify problems. Use surveys to understand why those problems exist. If your analytics shows a 70% bounce rate on your pricing page, that's a problem. Session replay might show users scrolling up and down repeatedly, suggesting confusion. A survey asking "Did you find the information you needed?" with options "Yes," "No," and "I'm still looking" reveals whether the problem is missing information, unclear pricing, or something else.
Trigger surveys based on behavioral signals. Show a "Was this helpful?" survey after users spend more than two minutes on a help article. Show a "What brought you here today?" survey to users who land on your homepage from organic search. Show a "What stopped you?" survey to users who add items to cart but don't proceed to checkout.
Create a survey template with three questions: "What brought you here today?" (open text field), "Did you find what you needed?" (Yes/No/Still looking), and "What stopped you from [converting]?" (open text field, only shown to users who didn't convert). Trigger the first question on landing, the second after 30 seconds or scroll to bottom, and the third on exit intent for non-converters.
Building Your Privacy-First Analytics Stack
The 3-Tool Minimum Setup
Start with one main analytics tool for traffic and conversion tracking, one session replay tool for behavioral analysis, and one feedback method for qualitative insights. This combination covers quantitative metrics, individual user journeys, and direct user feedback.
For the main analytics tool, choose between Plausible for simplicity and privacy focus, or Swetrix for more advanced features like error tracking and performance monitoring. Both are cookie-free for core analytics and can avoid analytics consent banners when configured appropriately. Plausible's 2.5KB script loads faster than any traditional analytics platform, while Swetrix offers opt-in Cloud session replay alongside its analytics stack when you need behavioral context.
Add Microsoft Clarity for session replay if you're not using Swetrix's opt-in built-in replay. Clarity is free, has no traffic limits, and includes heatmaps alongside session recordings. Configure field masking for password and payment fields, set data retention to 30 days, and enable IP anonymization.
Implement on-page surveys using a lightweight tool like Hotjar's free tier (50 responses per month) or a custom solution using sessionStorage for display logic. Keep surveys to three questions maximum and trigger them based on user behavior, not arbitrary timers.
Implementation Timeline and Testing
Run parallel tracking for four to six weeks before migrating from your old analytics setup. Install your new privacy-first tools alongside Google Analytics or your current platform. Compare daily reports to identify discrepancies and verify that the new tools capture all traffic sources.
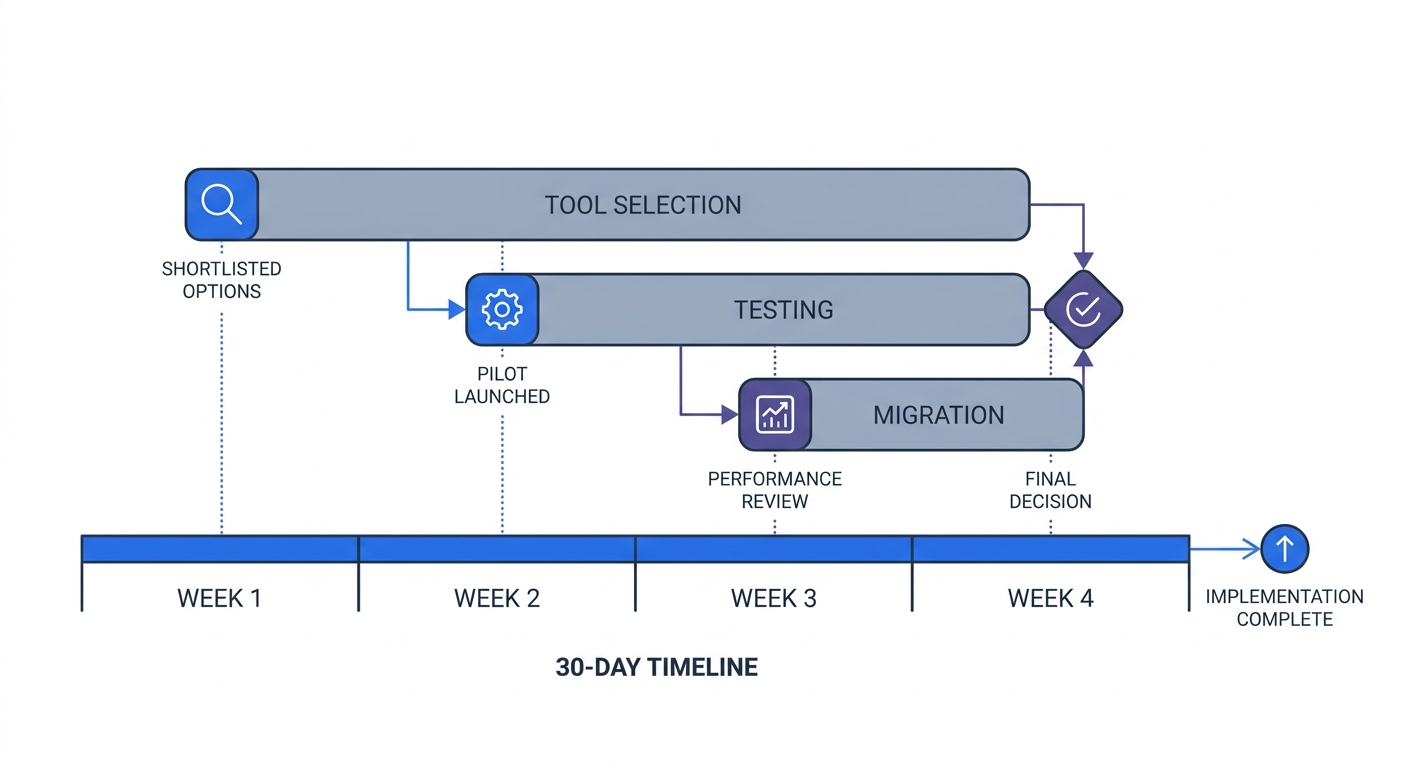
Week one: Audit your current analytics setup by documenting all tracked events, conversion goals, and custom reports. Export the last 90 days of data for baseline comparison. Install your chosen privacy-first analytics tool by adding the script tag to your site header and configuring basic settings (timezone, currency, excluded pages).
Week two: Select your session replay and survey tools based on budget and feature requirements. Install both tools with privacy settings enabled from the start: field masking, IP anonymization, and 30-day data retention. Create a campaigns calendar that maps each marketing channel to specific UTM parameters for consistent tracking.
Week three: Begin parallel testing by comparing daily traffic, conversion rates, and top pages between your old and new analytics platforms. Document any discrepancies—the new tool should show substantially more traffic if your old tool required cookie consent. Set up custom events for key interactions: form submissions, button clicks, video plays, and file downloads.
Week four: Complete migration by removing your old analytics script and updating all documentation to reference the new platform. Train your team on the new dashboard, create saved reports for weekly reviews, and set up automated alerts for traffic drops or conversion rate changes.
Measuring Success Without Compromising Privacy
Privacy-first analytics provides the metrics that matter—traffic sources, conversion rates, top pages, and user paths—without tracking individuals across sessions or sites. Measure success by comparing these metrics before and after migration, not by comparing feature lists.
Companies with first-party data strategies achieve 2.9x higher revenue growth compared to those dependent on third-party cookies. The improvement comes from better data quality, not more data. Privacy-first tools capture more complete coverage of traffic, while cookie-based tools miss half their audience.
Track these metrics weekly: total traffic (should increase substantially after removing consent requirements), conversion rate (should stay stable or improve as you optimize based on complete data), top traffic sources (should show more accurate attribution), and bounce rate by page (should reveal previously hidden problem pages).
Create a structured data layer that defines every tracked event, its parameters, and its business purpose. Document this in a shared spreadsheet with columns for event name, trigger condition, parameters collected, and which team member owns that metric. This structure simplifies reporting across teams and prevents duplicate tracking implementations.
Ensure API access for developers and agencies by choosing tools with well-documented APIs. Swetrix provides a REST API for querying analytics data, creating custom dashboards, and integrating with other tools. Use the API to build automated reports, sync data to your CRM, or trigger alerts when metrics exceed thresholds.
Privacy-first analytics tools capture the complete user journey without cookies, consent banners, or personally identifiable information. Traditional heatmaps show where users click but miss mobile traffic, lose substantial portions of their audience to consent rejections, and can't explain why users behave the way they do.
Switch to a privacy-first stack—one main analytics tool, one session replay tool, and one feedback method—and your traffic numbers will increase substantially overnight. Not because you gained new visitors, but because you're seeing the ones who were always there.
Start your free Swetrix trial to track higher coverage of your traffic without cookies or consent banners for core analytics. The platform includes analytics, optional session replay, and error tracking in a single privacy-first tool; start replay only after your consent flow, masking, and retention choices are configured.