- Date
How to Track Video Engagement on Website
 Andrii Romasiun
A product video sits on your landing page. Visitors land, scroll past it, and leave. You check analytics and see 500 page views, but have no idea if anyone watched the video, how long they stayed, or whether it influenced the three conversions that day.
Video engagement tracking closes this gap. Install the right tracking setup, and you'll see which videos hold attention, where viewers drop off, and which clips drive purchases. The data reveals whether your video budget returns revenue or burns cash.
Why Video Engagement Tracking Matters for Your Website
Video dominates web traffic. 82.5% of all internet traffic now comes from video content, making it the primary way people consume information online. Businesses recognize this shift: 91% now use video as a marketing tool, and 93% report strong ROI from their video efforts.
The business case extends beyond awareness. Product pages with video see significantly higher engagement rates than pages without. Users spend substantially more time on websites featuring video . These results materialize only when you track what works. Without tracking, you're guessing which videos convert and which waste production budget.
What Video Engagement Measures
View counts tell you nothing about quality. A video with 1,000 views where everyone watches 5 seconds performs worse than a video with 100 views where 80% watch to completion.
Engagement rate measures the percentage of a video that viewers watch. If your 2-minute video averages 60 seconds of watch time, engagement rate sits at 50%. This metric separates videos that hold attention from those that drive viewers away.
Track engagement to support specific business goals. Awareness campaigns need reach and impressions. Engagement campaigns require completion rates and watch time. Sales campaigns demand click-through rates and conversion tracking. Match your tracking to your objective. A brand awareness video succeeding at 40% engagement might fail as a product demo if it doesn't drive purchases.
Core Video Engagement Metrics to Track
Five core metrics reveal video performance. Track these before adding advanced analytics.
Primary Engagement Metrics
Play rate divides total plays by total page loads. If 1,000 visitors land on your page and 300 click play, play rate hits 30%. Low play rates signal poor video placement, unappealing thumbnails, or irrelevant content for that page's audience.
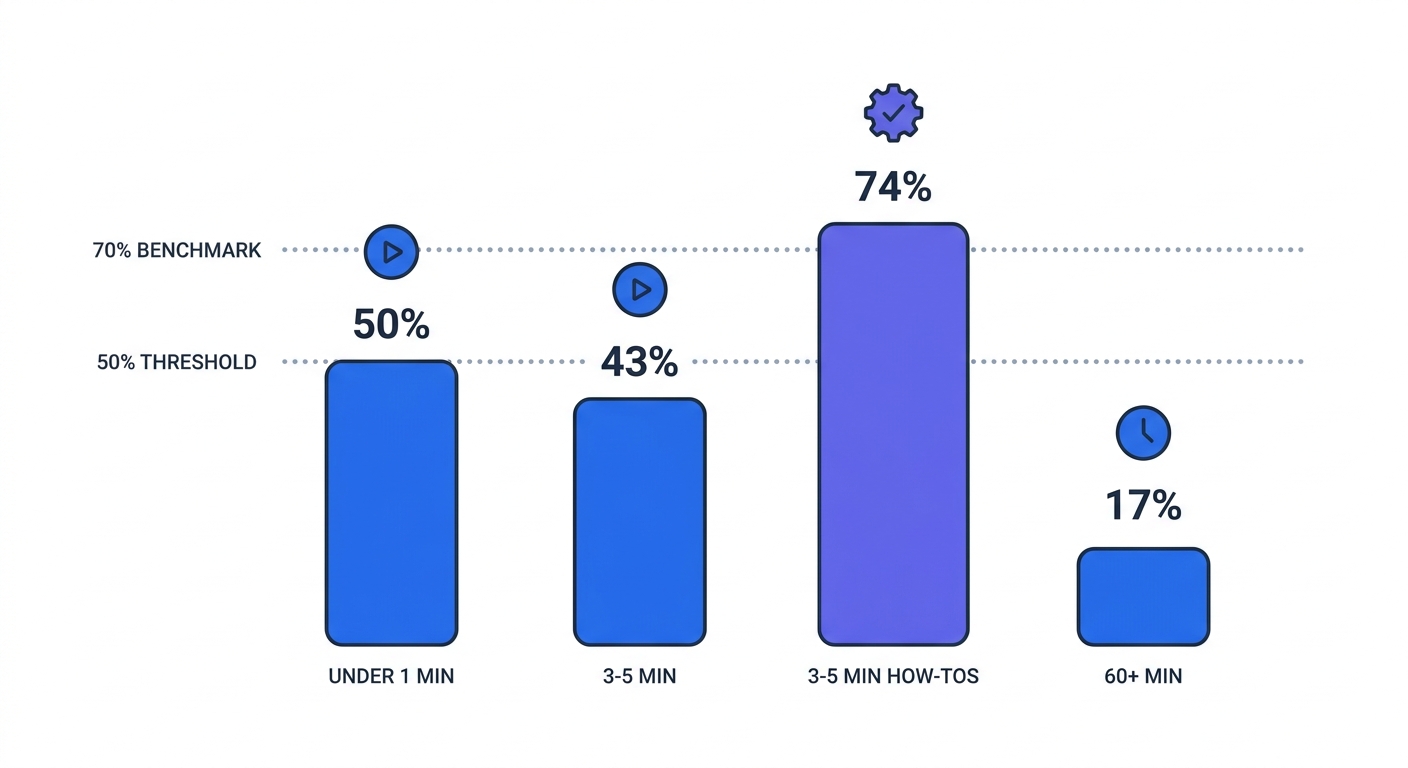
Engagement rate measures the percentage of your video that viewers watch. Videos under 1 minute achieve 50% engagement, meaning viewers watch an average of 30 seconds. 3-5 minute how-to videos reach 74% engagement, while videos longer than 60 minutes drop to 17%.
Benchmark your engagement rate against content length. Aim for 50-70% retention on videos under two minutes. 40-60% on longer content signals strong performance. Above 70% is excellent regardless of length.
Watch time aggregates total viewing minutes across all sessions. A 2-minute video with 500 complete views generates 1,000 minutes of watch time. This metric matters more than view counts because it reflects attention. Videos under one minute average 16 seconds of watch time, while 60+ minute videos average 16 minutes and 40 seconds.
Completion rate tracks the percentage of viewers who watch to the end. Target completion rates above 50% for most content. Educational videos should hit higher benchmarks since viewers seeking solutions watch through.
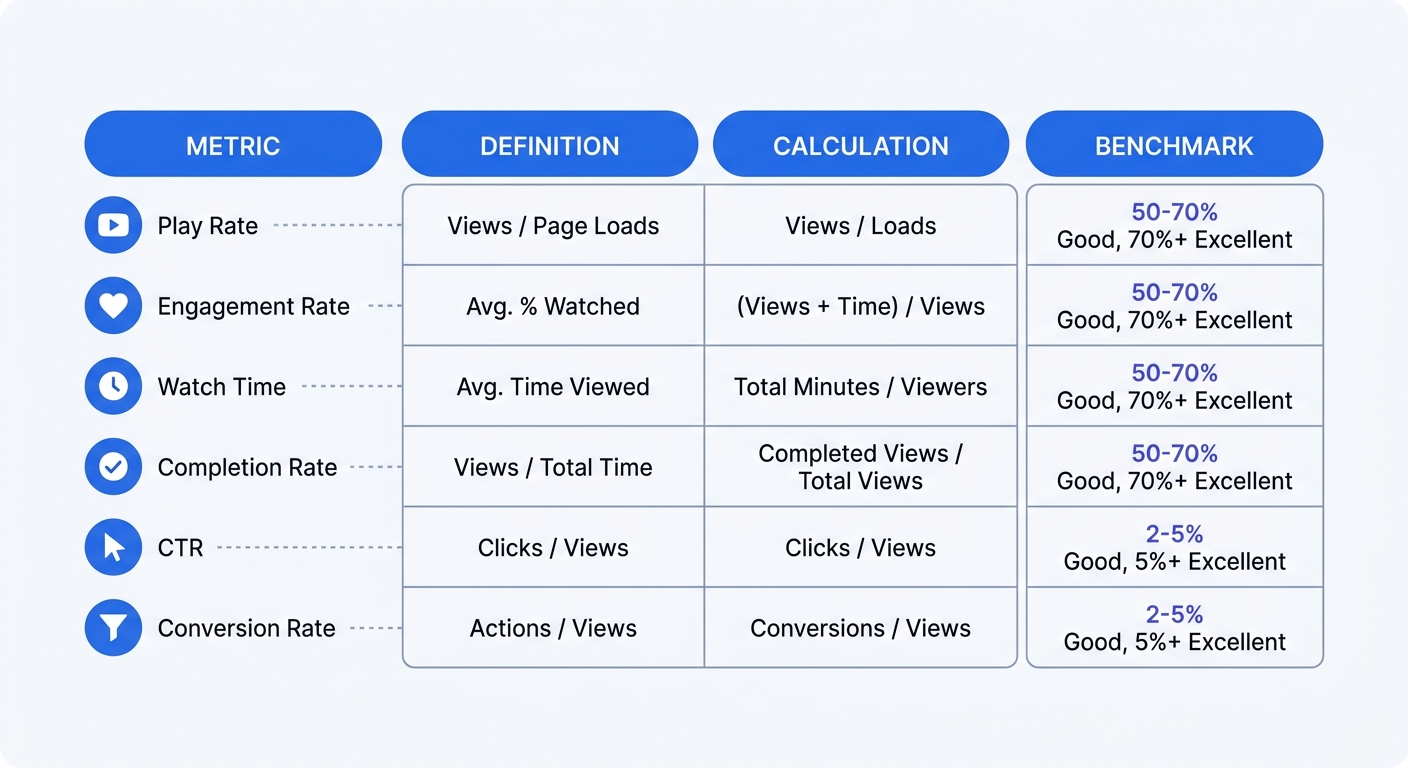
Conversion and Action Metrics
Click-through rate (CTR) measures actions taken divided by actions seen. Add a CTA button to your video. If 1,000 viewers see the button and 50 click it, CTR equals 5%. This metric connects video engagement to business outcomes.
Conversion rate tracks viewers who complete your target action: signing up, purchasing, downloading. If 200 people watch your product video and 10 buy, conversion rate hits 5%. Track conversions separately for viewers who watched versus those who didn't. If video viewers convert at 8% and non-viewers at 2%, the video drives measurable revenue impact.
Advanced Analytics: Heatmaps and Retention
Video heatmaps show where viewers watch, skip, rewatch, or drop off. Red sections indicate high engagement. Blue sections show where viewers skip ahead. Gray sections mark drop-off points.
Use heatmaps to identify problem areas. If 60% of viewers skip the same 30-second segment, that section needs editing. If viewers rewatch a specific 10-second clip, that content resonates and deserves emphasis in future videos.
Audience retention rate graphs engagement over time. A steady decline is normal. Sharp drops reveal specific moments that lose viewers. Position your strongest content and CTAs before major drop-off points.
Check retention curves by traffic source. Organic search visitors might watch differently than paid social traffic. Segment your data to optimize videos for each audience.
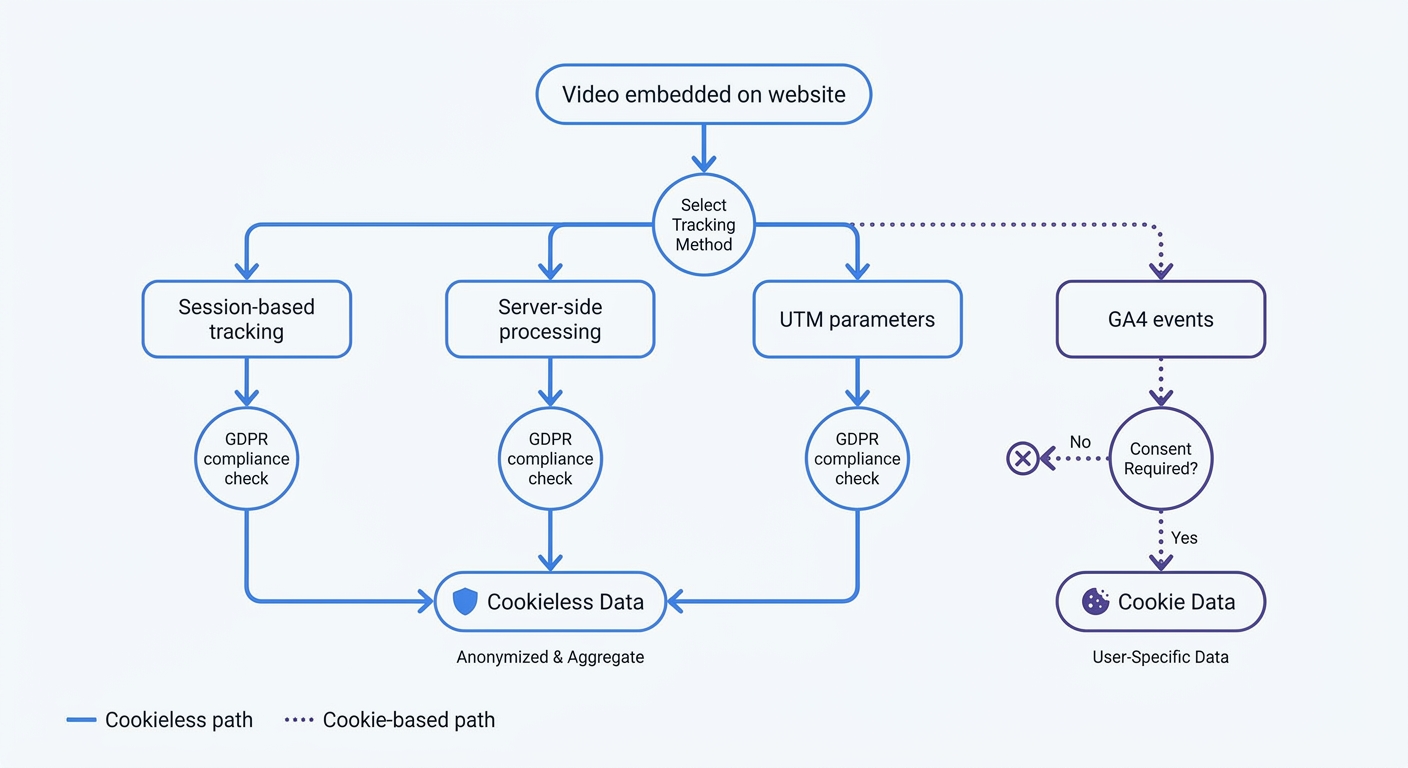
How to Set Up Video Tracking on Your Website
Three tracking approaches cover most use cases: Google Analytics 4 for embedded videos, native platform analytics for hosted content, and privacy-first alternatives for cookieless tracking.
Using Google Analytics 4 for Video Tracking
GA4's Enhanced Measurement tracks embedded videos without custom code. Enable it in your GA4 property settings under Data Streams > Enhanced Measurement > Video engagement.
GA4 fires three events: video_start when playback begins, video_progress at 10%, 25%, 50%, and 75% completion, and video_complete when the video finishes. These events appear in your reports within 24 hours.
Add UTM parameters to links driving traffic to video pages. Structure them as ?utm_source=facebook&utm_medium=cpc&utm_campaign=product_demo. GA4 attributes video engagement back to the original campaign, showing which traffic sources watch longest.
Check video engagement in GA4 under Reports > Engagement > Events. Filter by video_start to see total plays. Compare video_complete counts to video_start counts to calculate completion rate. Export the data to a spreadsheet for deeper analysis.
Video Hosting Platform Analytics
Vimeo, Wistia, and YouTube provide built-in analytics that track engagement without additional setup. These platforms measure watch time, retention, plays, pauses, and viewer locations.
Vimeo's analytics dashboard shows engagement graphs for each video. Hover over any point to see the exact percentage of viewers still watching at that timestamp. Download CSV exports to analyze trends across multiple videos.
Wistia tracks engagement by embed location. If you place the same video on three different pages, Wistia shows which page drives the highest play rate and longest watch time. This data reveals which contexts work best for each video type.
YouTube Analytics provides traffic sources, demographics, and retention curves. Check the "Audience retention" report to see average view duration and identify drop-off points. Compare retention across videos to find patterns in what holds attention.
Link your video platform to Google Analytics for unified reporting. Most platforms offer GA integration in their settings. Once connected, video events flow into GA alongside other site metrics.
Privacy-First Tracking Implementation
Safari, Firefox, and Brave together represent a significant portion of website visitors , and each blocks or restricts cookie-based analytics. Businesses switching to cookieless analytics often report seeing substantially more traffic than Google Analytics showed —capturing visitors who declined cookies or use ad blockers.
Privacy-first platforms like Swetrix track video engagement without cookies or personal data. The approach relies on server-side processing and session-based metrics. Install the Swetrix tracking script on your site, then use custom events to log video interactions.
Set up video tracking in Swetrix with event tracking:
swetrix.track({ ev: "video_play" });

swetrix.track({ ev: "video_25_percent" });

swetrix.track({ ev: "video_complete" });
Fire these events at the appropriate playback milestones using your video player's JavaScript API. Swetrix aggregates the data without storing individual user identifiers.
UTM parameters work with cookieless tracking. Tag your campaign links, and session-based analytics attribute video engagement to the correct source. The tracking persists within a single session without requiring cookies.
Server-side tracking processes data on your domain. No information flows to third-party servers. No fingerprinting attempts to identify users. When implemented correctly, this setup may comply with GDPR without requiring consent banners for analytics in many cases, though compliance depends on your specific implementation and jurisdiction. Consult with legal counsel or privacy experts to ensure your deployment meets applicable regulations.
Privacy, GDPR, and Cookie-Free Video Analytics
Video analytics data qualifies as personally identifiable information under GDPR. IP addresses, viewing behavior, and engagement patterns all fall under PII regulations when tied to individual users.
GDPR Requirements for Video Tracking
Cookie-based video analytics require explicit consent before tracking. GDPR mandates consent for non-essential cookies, with fines reaching €20 million or 4% of global revenue for violations. Video players should collect only anonymized data until viewers grant consent.
Most video platforms set cookies by default. YouTube embeds drop multiple tracking cookies. Vimeo and Wistia set session cookies. Without a consent management platform, these cookies violate GDPR from the first page load.
Consent banners reduce tracking coverage. Visitors who decline cookies disappear from your analytics. Consent rates vary by region and implementation, but expect 30-60% of European visitors to opt out. Your video engagement data becomes incomplete.
Why Cookie-Free Tracking Works Better
Cookieless analytics can sidestep consent requirements in many cases. When implemented correctly, these tools don't collect PII, don't use cookies or fingerprinting, and process data on your domain without third-party sharing. Multiple EU data protection authorities have indicated that privacy-first analytics may be exempt from consent requirements, though this depends on implementation specifics and local regulations.
The technical advantage compounds the legal benefit. Cookie-based tracking fails when browsers block third-party cookies. Safari and Firefox users never appear in your reports. Chrome's privacy features restrict cookie access. Cookieless tracking can capture significantly more visitors regardless of browser settings.
Session-based tracking provides the metrics you need without persistent identifiers. Track page views, time on site, and event sequences within a single visit. Aggregate this data across all sessions to identify patterns without linking behavior to individuals.
Implementing Compliant Video Analytics
Start with UTM parameters. These query strings remain the most reliable attribution method without cookies. Tag every video campaign link with source, medium, and campaign parameters. Your analytics platform reads these tags on page load and attributes engagement correctly.
Configure session-based tracking to capture video events. When a visitor clicks play, log a video_start event tied to their session ID. Track progress milestones and completion within the same session. Aggregate these events across all sessions to calculate engagement rates.
Use server-side processing for all analytics data. Install tracking scripts that send events to your own domain, not third-party servers. Process the data in your infrastructure before sending aggregated reports to your analytics dashboard. This architecture keeps PII out of the tracking pipeline.
Implement privacy-focused platforms that build compliance into their design. Swetrix processes all data server-side, stores no personal identifiers, and provides aggregate analytics without cookies. The platform tracks video engagement through custom events while maintaining GDPR compliance.
Optimizing Videos Based on Engagement Data
Tracking reveals problems. Optimization fixes them. Use your engagement data to improve video performance.
Content Length Optimization by Platform
Match video length to platform and content type. Instagram Reels between 60 and 90 seconds get the most engagement. LinkedIn videos perform best at 2 minutes. Website product demos should run 2-3 minutes to balance detail with retention.
Check your completion rate data by video length. If 5-minute videos average 30% completion while 2-minute videos hit 60%, cut your content shorter. Viewers tell you through their behavior how much time they'll invest.
Break long content into series. A 20-minute tutorial performs better as four 5-minute episodes. Each episode maintains higher engagement, and viewers who want the full content watch all four. Those who need specific information find the relevant episode without sitting through unrelated sections.
Using Heatmaps to Improve Retention
Heatmap data shows where viewers lose interest. If 40% drop off at the 45-second mark, review that section. Common problems include slow pacing, unclear explanations, or tangential content that breaks the narrative flow.
Position CTAs during high-retention moments. If your heatmap shows 70% of viewers still watching at 30 seconds but only 40% at 90 seconds, place your primary CTA at 30 seconds. Secondary CTAs can appear later for engaged viewers.
Identify rewatch sections. When viewers scrub back to rewatch a specific segment, that content delivers value. Expand similar content in future videos. If viewers rewatch a product feature demonstration, create dedicated videos for each feature.
Test different openings. The first 10 seconds determine whether viewers stay or leave. Try multiple hooks: questions, bold statements, visual demonstrations, or problem descriptions. Track retention curves for each version to find what works.
A/B Testing and Iteration Strategies
Run split tests on video elements one at a time: thumbnail, title, opening hook, video length, CTA placement, or background music. Send half your traffic to version A and half to version B. Compare engagement rates after 500 views per version.
Test thumbnails first. A compelling thumbnail increases play rate by 20-50%. Create three thumbnail options for each video. Run them on different pages or in different campaigns. The winner becomes your default.
Experiment with CTA timing. Place your call-to-action at 25%, 50%, and 75% completion in three separate tests. Measure click-through rate for each position. Some audiences respond to early CTAs, others need to see the full content first.
Adjust content based on traffic source. Organic search visitors often seek specific information and tolerate longer videos. Paid social traffic expects quick value and drops off faster. Create two versions: a comprehensive 5-minute video for organic traffic and a 90-second highlight for paid campaigns.
Track integration effectiveness. Link your video analytics to your marketing automation platform. Tag viewers who watch 75%+ completion and trigger follow-up sequences. Compare conversion rates for viewers versus non-viewers to quantify video impact.
Best Practices for Privacy-Focused Video Analytics
Privacy-first tracking requires different implementation patterns than traditional analytics. Follow these practices to maintain compliance while capturing useful data.
Aggregate Data vs Individual Tracking
Focus on trends, not individuals. Track how many viewers watched to 50% completion, not which specific users did. Calculate average watch time across all sessions rather than building user profiles. This aggregation provides actionable insights without collecting PII.
Segment by session characteristics instead of user attributes. Compare engagement rates for mobile versus desktop sessions, organic versus paid traffic, or different landing pages. These segments reveal optimization opportunities without identifying individuals.
Avoid persistent identifiers. Don't assign user IDs, don't fingerprint devices, and don't link sessions across visits. Each session stands alone in your analytics. Aggregate metrics across all sessions to identify patterns.
Monitoring Frequency and Reporting
Check video metrics weekly for active campaigns. New videos need frequent monitoring to catch problems early. If engagement rates drop below benchmarks in the first week, adjust the content before spending more on promotion.
Review evergreen content monthly. Videos that stay on your site long-term accumulate data slowly. Monthly reviews provide enough data points to spot trends without overwhelming your schedule.
Monitor after each video release. The first 100 views reveal whether your video holds attention. If completion rate sits below 40% in the first day, investigate before promoting further.
Set up automated alerts for significant changes. If play rate drops 30% week-over-week, something broke: the video player, the page layout, or the traffic source. Catch these issues before they compound.
Integration with Marketing Stack
Connect video analytics to your CRM. When a lead watches your product demo to completion, that signal indicates high intent. Trigger sales notifications or automated follow-up sequences based on video engagement.
Link video data to email marketing. Segment your list by video engagement. Viewers who watched 75%+ of your educational content receive different messaging than those who bounced after 10 seconds. Personalize follow-up based on which videos they watched.
Integrate with advertising platforms. Facebook Pixel and Google Ads conversion tracking should fire when viewers complete specific video milestones. This connection enables retargeting based on video engagement and optimizes ad delivery toward viewers who watch longest.
Track likes, shares, and comments alongside completion rates. High social engagement with low completion rates suggests your thumbnail and title work but your content needs improvement.
Build dashboards that combine video metrics with other performance indicators. Place video engagement alongside conversion rates, revenue, and customer acquisition cost. This context shows whether video investment drives business results or vanity metrics.
Video engagement tracking transforms guesswork into strategy. Install the right tracking setup, monitor the metrics that match your goals, and optimize based on what the data reveals. Start with play rate and completion rate. Add conversion tracking once you understand basic engagement patterns.
Privacy-first analytics provide complete data without compliance headaches. Swetrix tracks video engagement through custom events while maintaining GDPR compliance. No cookies, no consent banners, no data gaps from browser restrictions. Start your free 14-day trial to see how cookieless video analytics captures the full picture of viewer behavior.