- Date
How to Track Social Media ROI in 2026
 Andrii Romasiun
A marketing director logs into their social media dashboard and sees 50,000 impressions, 2,000 clicks, and 500 likes. The CEO asks one question: "What revenue did this generate?" The director has no answer.
This scenario plays out daily across companies of every size. 61.1% of social media marketers cite measuring ROI as their top challenge, and only 30% use data to measure social media ROI. The gap between activity metrics and business impact remains wide despite billions spent on social advertising.
The problem isn't lack of data. Most teams drown in metrics from Facebook Insights, Instagram Analytics, LinkedIn Campaign Manager, and TikTok Ads. The challenge is connecting social media activity to revenue, then proving which campaigns justify their budget and which drain resources.
This article walks through the measurement framework that turns vanity metrics into business intelligence. You'll learn how to set up attribution that survives privacy regulations, calculate true costs including hidden expenses, and build reporting systems that answer executive questions with numbers instead of engagement rates.
What Is Social Media ROI and Why It Matters
Defining Social Media ROI
Social media ROI measures the business value your social efforts generate relative to what you invest. The basic formula: [(Earnings – Costs) ÷ Costs] × 100. A campaign that costs $10,000 and generates $30,000 in revenue delivers 200% ROI.
Earnings include direct revenue from social commerce, leads that convert to sales, and customer lifetime value from social-acquired users. Costs encompass more than ad spend. Add employee hours, content production expenses, software subscriptions, and agency fees. A $5,000 ad campaign that requires 40 hours of internal work at $50/hour costs $7,000.
The calculation extends beyond immediate purchases. B2B companies measure pipeline contribution and deal influence. Brand campaigns track awareness lift and share of voice. Customer service teams count resolution rates and satisfaction scores. Each business model requires different value metrics, but the core principle remains: quantify what you gain versus what you spend.
The ROI Measurement Challenge
Attribution breaks down across multiple devices and private channels. A customer sees your Instagram ad on their phone during lunch, researches your product on a work laptop that afternoon, then purchases on their home desktop that evening. Default analytics credits the desktop session and ignores the mobile touchpoints that initiated the journey.
Dark social compounds the problem. When someone shares your content through WhatsApp, Slack, or email, that traffic appears as "direct" in your analytics. The original social post that sparked the share receives no credit. Private messaging apps now drive more content sharing than public social networks, yet this activity remains invisible to standard tracking.
Data fragmentation creates blind spots. Customer information lives in Facebook Ads Manager, Instagram Insights, LinkedIn Campaign Manager, Google Analytics, and your CRM. Each platform uses different attribution windows, conversion definitions, and reporting periods. Reconciling these sources introduces errors and delays that make real-time optimization impossible.
What Good ROI Looks Like
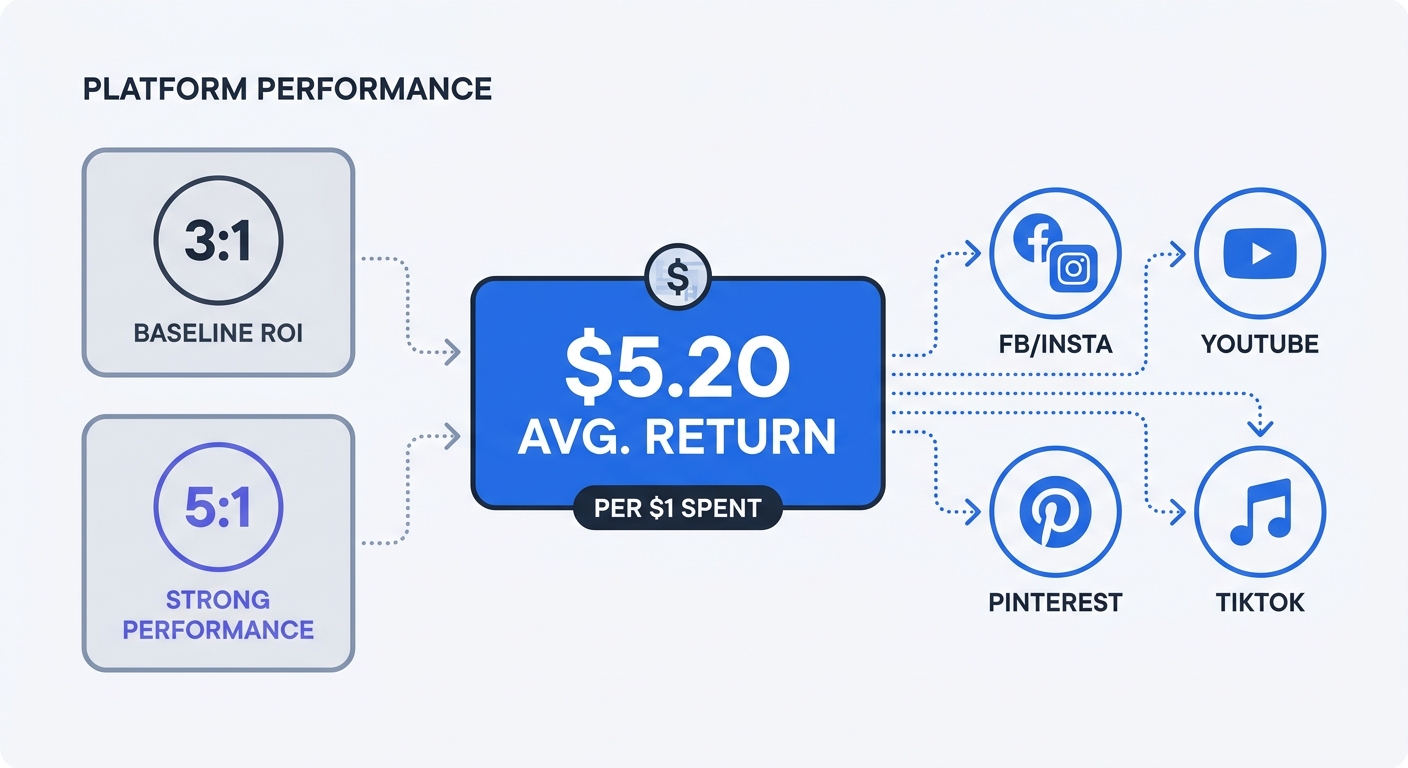
A 3:1 return is considered the standard baseline across most industries, meaning $3 in value for every $1 spent. Paid social campaigns should target 5:1 as a strong benchmark. These ratios provide starting points, not universal targets.
Industry and margin structure determine what constitutes good performance. A SaaS company with 80% gross margins can profit from 2:1 campaigns because customer lifetime value compounds over years. An e-commerce retailer with 20% margins needs 6:1 to break even after fulfillment costs and returns.
Social media marketing delivers an average ROI of $5.20 for every $1 spent, but this aggregate masks wide variation. Your benchmark depends on business model, product price point, sales cycle length, and competitive intensity. A luxury brand building awareness over months measures performance different from a DTC brand driving immediate purchases.
Platform performance varies. Facebook and Instagram deliver the highest ROI according to global marketers, while Pinterest generates 2x higher ROAS than Facebook and Instagram for some advertisers. Test multiple channels with small budgets before committing to scale.
The Four-Step Framework for Measuring Social Media ROI
Step 1: Set Clear, Measurable Goals
Align social objectives with business priorities before launching campaigns. 65% of leaders want to see direct connections between social media campaigns and business goals, yet many teams optimize for engagement without linking it to revenue.
Define what success means for each campaign type. Brand awareness campaigns track reach, impressions, and share of voice. Lead generation measures form submissions and qualified leads. E-commerce drives transactions and average order value. Customer retention focuses on repeat purchase rate and lifetime value.
Assign dollar values to non-revenue goals. Calculate the average value of a qualified lead by dividing closed revenue by lead volume. Estimate brand awareness value using earned media equivalency or survey-based brand lift studies. Quantifying soft metrics makes ROI calculation possible.
Set specific targets with deadlines. "Increase brand awareness" is vague. "Generate 500 qualified leads at $50 cost per lead within Q2" provides a measurable target. Document assumptions about conversion rates, average deal size, and time to close so you can refine estimates as data accumulates.
Step 2: Track the Right Metrics
Teams focus on engagement (68%), conversions (65%), and revenue impact (57%) when tracking social media ROI. Layer these metrics to build a complete picture from awareness to revenue.
Top-of-funnel metrics include reach, impressions, and follower growth. These indicate audience size but don't prove business impact. Track them to ensure your content reaches potential customers, not as success measures.
Mid-funnel engagement shows interest level. Click-through rate, video completion rate, and time spent with content signal whether your message resonates. High engagement with low conversion suggests messaging problems or targeting mismatches.
Bottom-funnel conversions connect social activity to business outcomes. Track leads generated, purchases completed, and revenue attributed. Use platform-specific conversion pixels and your analytics platform to measure these actions.
Calculate cost per action for each metric. Divide total campaign spend by the number of leads, purchases, or other conversions. Compare these costs across platforms and campaigns to identify your most efficient channels.
Step 3: Calculate Total Costs
Ad spend represents only part of your investment. Employee time often exceeds media costs for organic social programs. A content creator spending 20 hours per week on social media at $75/hour costs $78,000 per year before any ad spend.
Content production adds hidden expenses. Photography, videography, graphic design, and copywriting all carry costs whether handled in-house or outsourced. A single professional video can cost $2,000-$10,000 depending on complexity.
Software and tools compound monthly. Social media management platforms, analytics tools, design software, and stock photo subscriptions run $500-$2,000 per month for small teams. Enterprise solutions cost more.
Agency and consultant fees must be included when calculating ROI. A $5,000 monthly retainer adds $60,000 to annual costs. Factor these expenses into campaign-level calculations to understand true profitability.
Step 4: Report Results to Stakeholders
Campaign-level measurement provides actionable insights that big-picture reporting misses. Breaking down performance by individual campaign, platform, and content type reveals what works and what wastes budget.
Create a standard reporting template that shows costs, results, and ROI for each campaign. Include the metrics that matter to your stakeholders: leads for sales teams, revenue for executives, engagement for brand managers.
Compare performance across time periods to identify trends. Month-over-month and year-over-year comparisons show whether your ROI is improving. Seasonal businesses should compare to the same period in previous years rather than sequential months.
Explain attribution methodology in your reports. Stakeholders need to understand whether you're using last-click, multi-touch, or data-driven attribution. Different models produce different results, and transparency prevents confusion when numbers don't match expectations.
Solving the Attribution Problem
Why Last-Click Attribution Fails
Last-click attribution credits the final touchpoint before conversion and ignores everything that came before. A customer might see your Facebook ad, read your blog post, watch your YouTube video, and then click a Google search ad before purchasing. Last-click gives 100% credit to the search ad and zero to the social touchpoints that built awareness and consideration.
When Sprout's social team switched from last-touch to multi-touch attribution, they uncovered a 5,800% increase in pipeline impacted by social efforts. This discrepancy reveals how last-click undervalues social media's contribution.
The mobile-to-desktop conversion path suffers under last-click models. Users browse social media on phones during commutes and breaks, then complete purchases on desktop computers where they feel more comfortable entering payment information. The mobile ad that initiated the journey receives no credit.
TikTok's true ROI is 17x higher than last-click attribution suggests when measured through Marketing Mix Modeling. The platform influences purchasing behavior through brand recall rather than direct clicks, making last-click measurement misleading.
Multi-Touch Attribution Models
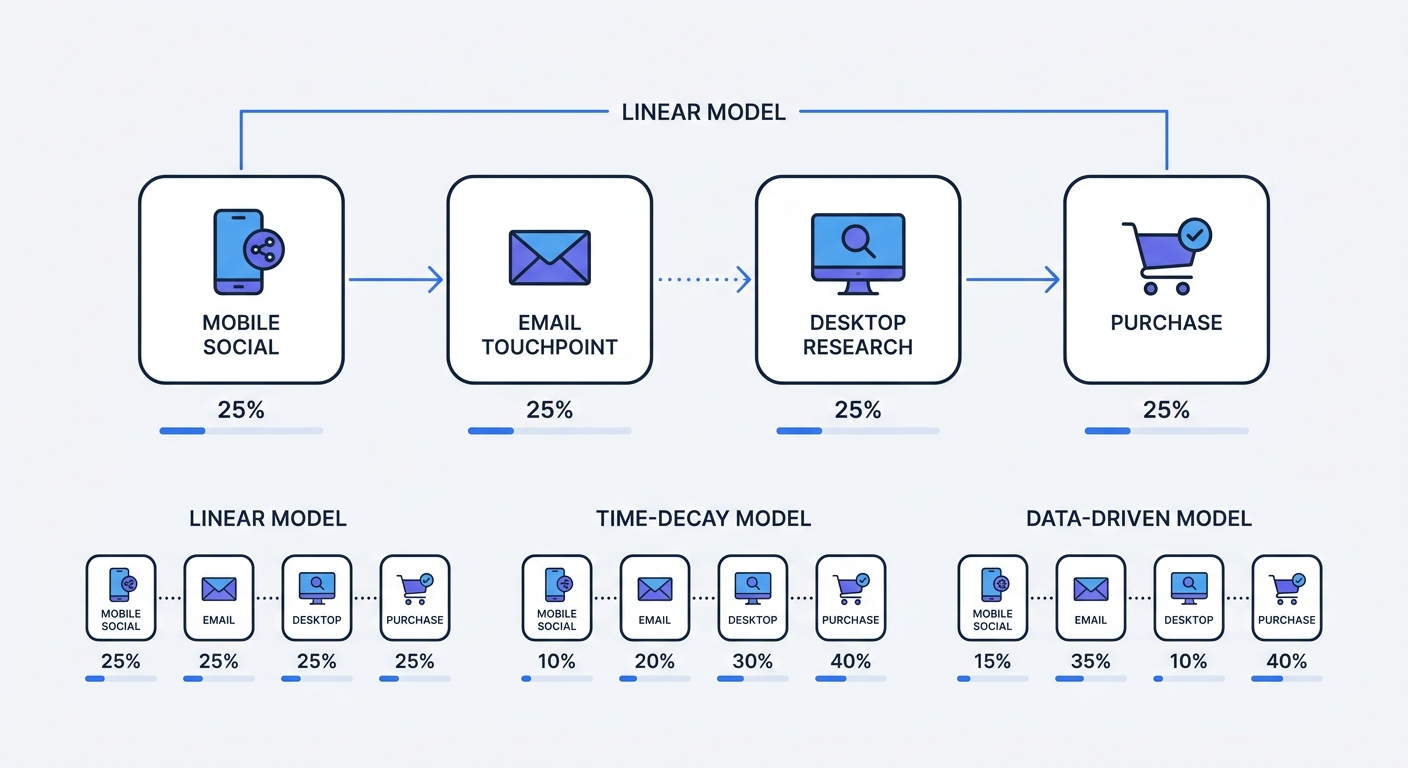
Linear attribution distributes credit across all touchpoints. If a customer interacts with your brand through Instagram, email, and Google before purchasing, each channel receives 33% credit. This model acknowledges that multiple touchpoints contribute to conversion, though it may overvalue early awareness touches and undervalue final conversion drivers.
Time-decay attribution gives more weight to recent interactions. A customer's first touchpoint might receive 10% credit, middle interactions 20-30%, and the final touchpoint 40-50%. This approach works well for B2C brands with shorter sales cycles where recent interactions have stronger influence on purchase decisions.
Position-based attribution assigns 40% credit to the first and last touchpoints, then distributes the remaining 20% among middle interactions. This model recognizes that initial awareness and final conversion moments matter most while acknowledging the nurturing that happens between them.
Data-driven attribution uses machine learning to analyze your conversion paths and assign credit based on statistical impact. This model requires substantial data volume (thousands of conversions) to produce reliable results. Allow at least 3-6 months of data collection before trusting data-driven attribution results.
Privacy-First Attribution Strategies
UTM parameters provide privacy-compliant tracking that works without cookies. Append source, medium, and campaign tags to every social media link: ?utm_source=facebook&utm_medium=cpc&utm_campaign=spring_sale. Your analytics platform parses these parameters on page load and attributes traffic to the correct campaign.
Maintain consistent UTM naming conventions across your team. Create a documented standard for how you'll name sources (facebook, instagram, linkedin), mediums (cpc, organic, social), and campaigns (product_launch_q2, spring_sale_2026). Inconsistent naming splits your data into separate rows and makes reporting impossible.
Keep a central UTM log in a shared spreadsheet. Record every campaign's UTM structure before launch. This prevents duplicate campaign names and ensures you can match analytics data back to specific initiatives months later.
Server-side tracking bypasses browser-based limitations that plague client-side analytics. Over 72% of B2B companies now employ server-side tracking, reporting an average 45% data quality improvement over client-side approaches. Implement Meta's Conversions API, TikTok's Events API, and Pinterest API to send conversion data from your server to ad platforms.
Privacy-First Tracking Without Cookies
The Cookie Deprecation Reality
Europe has issued 2,679 GDPR fines totaling over €6.7 billion since May 2018, with enforcement intensifying each year. The California Privacy Protection Agency imposed a fine of $350,000 on Capital One in May 2025 for using Meta Pixel and Google Analytics without user consent.
Several EU data protection authorities have declared Google Analytics non-compliant with GDPR because it transfers data to US servers. Austria, France, Italy, and Denmark have all ruled against Google Analytics in specific cases. Switching to privacy-first alternatives removes regulatory risk.
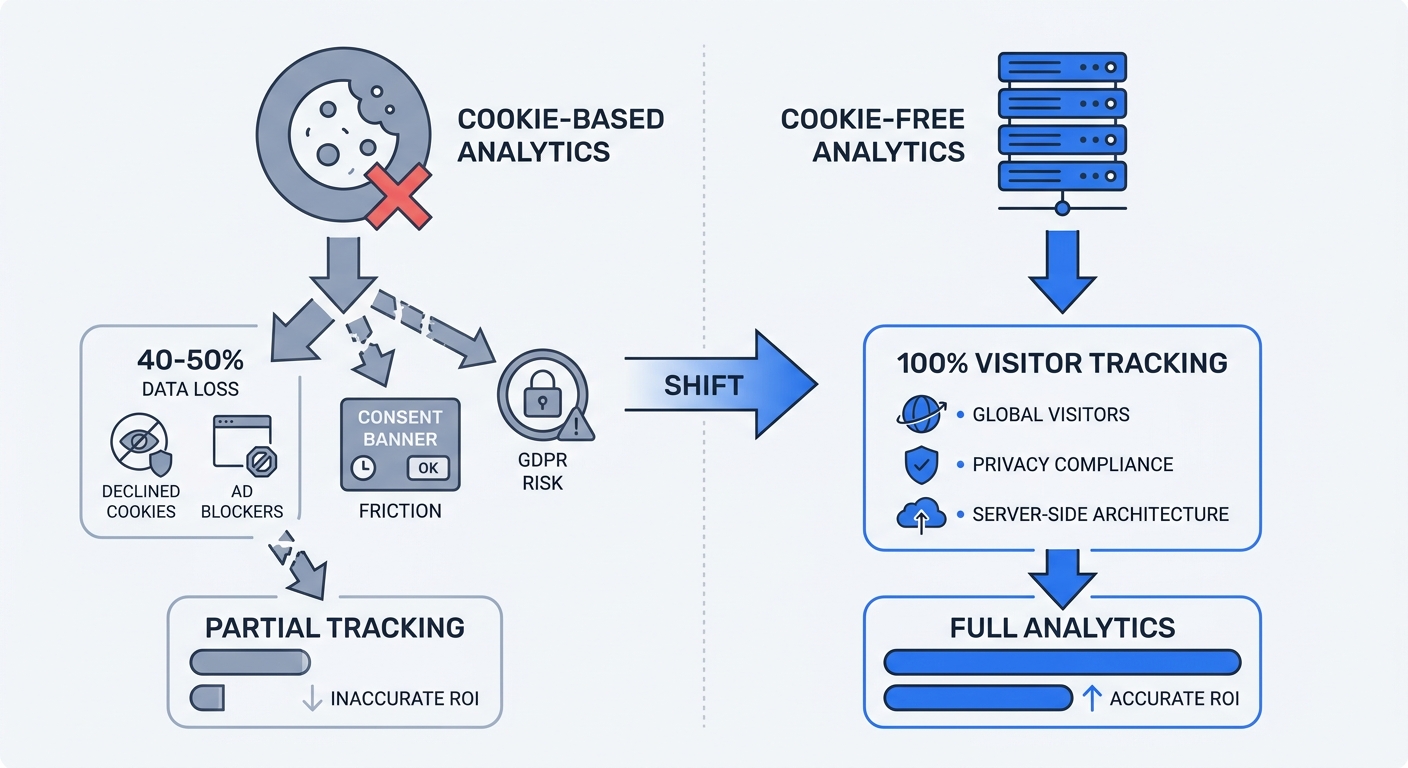
Cookie consent banners create data gaps that distort your analytics. Visitors who decline cookies aren't tracked at all in traditional analytics platforms. Depending on your audience, 40-60% of traffic may be invisible because users rejected tracking. Your reports show only the subset of visitors who accepted cookies, not your total traffic.
How Cookie-Free Analytics Works
Privacy-first analytics platforms track aggregate pageviews and referrers without collecting personal data or using cookies. These tools generate anonymous session identifiers that reset daily, making it impossible to track individuals across time while providing accurate traffic counts.
Cookieless analytics captures visitors who declined cookies or use ad blockers (often 40-50% more data than cookie-based analytics). You see your complete traffic picture instead of a filtered subset.
No consent banner is required because these platforms don't process personal data. Multiple EU data protection authorities, including France's CNIL and Germany's DSK, have confirmed that privacy-first analytics tools are exempt from consent requirements when configured correctly.
Swetrix provides cookie-free analytics that tracks social media traffic without GDPR consent requirements. The platform captures referrer data, UTM parameters, and conversion events while respecting user privacy. Visit swetrix.com to set up privacy-compliant tracking in under 10 minutes.
UTM Parameters and Server-Side Tracking
Tag every social media link with UTM parameters, not paid ads alone. Organic posts, influencer content, email signatures, and partner links all need tracking codes. Tagging reveals which channels drive results and which waste effort.
Use lowercase for all UTM values. Parameters are case-sensitive, so Facebook and facebook appear as separate sources in reports. Standardize on lowercase to prevent data fragmentation.
Implement server-side tracking for paid campaigns. Meta's Conversions API, TikTok's Events API, and Pinterest API send conversion data from your server to ad platforms, bypassing browser-based tracking limitations. This approach captures conversions that client-side pixels miss due to ad blockers or privacy settings.
Configure your server to forward conversion events with customer information hashed using SHA-256. Platforms can match conversions to ad clicks without receiving raw personal data. This privacy-preserving approach improves attribution accuracy while maintaining compliance with data protection regulations.
Platform-Specific ROI Strategies
High-ROI Platforms and Content Types
Short-form video delivers the highest ROI among video formats at 41%, with Instagram Reels reaching 30.81% average reach rate (double other content formats). Prioritize vertical video under 60 seconds for maximum engagement and conversion.
YouTube provides strong ROI for educational content and product demonstrations. Longer videos (8-15 minutes) perform well when they solve specific problems or teach valuable skills. Use YouTube for mid-funnel content that builds trust and demonstrates expertise.
Pinterest excels for visual products and DIY content. The platform's users search for products to buy, making them more purchase-ready than passive social media scrollers. Create detailed pins with product information and pricing to capture high-intent traffic.
LinkedIn delivers the highest quality B2B leads despite lower overall volume. Focus on thought leadership content, industry insights, and case studies. Engagement rates are lower than other platforms, but the leads generated have higher deal values and conversion rates.
B2B vs B2C Attribution Differences
B2B sales cycles require longer attribution windows because deals take months to close. Set your attribution window to 90-180 days to capture the full customer journey from initial awareness to closed deal. A 30-day window misses most B2B conversions.
Track assisted conversions in addition to last-click conversions. A social media post might not generate a demo request, but it could influence a prospect who later converts through a different channel. Assisted conversion reports show social media's role in the broader sales process.
B2C purchases happen faster, often within days or weeks of first exposure. A 30-day attribution window captures most conversions. Time-decay models work well because recent touchpoints have stronger influence on impulse purchases and immediate needs.
Measure micro-conversions for high-consideration B2C products. A furniture retailer or car manufacturer should track showroom visits, brochure downloads, and configurator usage in addition to final purchases. These mid-funnel actions indicate purchase intent even when the sale happens offline.
Measuring Short-Form Video and Influencer ROI
94% of organizations say influencer marketing outperforms traditional digital advertising, often delivering 2x-3x returns. 49% of consumers make purchases at least once a month because of influencer posts, making influencer partnerships a high-ROI channel for many brands.
Provide influencers with unique discount codes or affiliate links to track conversions. These attribution methods work across platforms and don't require complex tracking infrastructure. Monitor code usage in your e-commerce platform to calculate ROI per influencer.
Track engagement rate, not follower count, when selecting influencers. Micro-influencers with 10,000-50,000 followers often deliver better ROI than celebrities because their audiences are more engaged and trust their recommendations more.
Measure brand lift through surveys before and after influencer campaigns. Ask target audiences about brand awareness, consideration, and purchase intent. The difference between pre- and post-campaign scores quantifies the awareness value that direct conversion tracking misses.
Building Your ROI Measurement System
Tools and Integrations
Choose a privacy-first analytics platform that doesn't require cookie consent. Swetrix, Plausible, Fathom, and Simple Analytics all provide GDPR-compliant tracking without consent banners. These platforms capture more complete data than cookie-based alternatives because they track visitors who decline cookies.
Connect your analytics platform to your CRM to close the loop between social media activity and closed revenue. This integration reveals which campaigns generate leads that convert to customers and which produce leads that never buy.
Use a UTM generator tool to create consistent tracking codes. Swetrix provides a free UTM builder that follows best practices and maintains your naming conventions. Standardized UTMs prevent the data fragmentation that makes reporting impossible.
Implement social media management software that consolidates reporting across platforms. Tools like Hootsuite, Sprout Social, or Buffer aggregate data from multiple networks into unified dashboards. This consolidation saves hours of manual reporting and reduces errors.
Creating Your Measurement Dashboard
Build a dashboard that shows campaign-level performance, not account-level metrics alone. Break down results by individual campaign, ad set, and creative to identify what works. Aggregate reporting hides the winners and losers that determine overall ROI.
Include these metrics in every dashboard: total spend, impressions, clicks, click-through rate, conversions, cost per conversion, revenue, and ROI. Add platform-specific metrics like video completion rate or engagement rate where relevant.
Create separate views for different stakeholders. Executives need high-level ROI and revenue numbers. Marketing managers need campaign-level performance and optimization insights. Social media specialists need creative-level data and engagement metrics.
Update dashboards weekly for active campaigns and monthly for ongoing programs. Real-time data enables quick optimization, but daily updates create noise that obscures trends. Weekly reviews provide enough frequency to catch problems while maintaining perspective on performance patterns.
Continuous Optimization
Test one variable at a time to isolate what drives performance. Change your targeting, creative, or offer (not all three at once). Sequential testing takes longer but produces clear insights about what works.
Allocate 80% of budget to proven campaigns and 20% to testing new approaches. This balance maintains consistent ROI while exploring opportunities for improvement. Shift budget toward winners as test results accumulate.
Review attribution models quarterly to ensure they reflect your customer journey. As your business evolves, the touchpoints that matter most may change. Update your attribution approach to match current reality.
Only 40% of marketers use AI for performance reporting and analysis, leaving significant competitive advantage available. Implement AI-powered analytics tools that identify patterns and anomalies faster than manual review.
Calculate customer lifetime value for social-acquired customers versus other channels. Social media might generate lower immediate revenue but higher long-term value if those customers make repeat purchases or refer friends. Include LTV in ROI calculations to capture this extended value.
Measuring social media ROI requires privacy-compliant tracking, accurate attribution, and systematic reporting. The tools and frameworks outlined here provide the foundation for proving social media's business impact.
Start with Swetrix's free trial to implement cookie-free analytics that captures complete traffic data without consent banners. The platform tracks UTM parameters, conversion events, and referrer data while maintaining GDPR compliance. Set up takes less than 10 minutes, and you'll see more accurate data than cookie-based alternatives from day one.