- Date
How To Measure Product Market Fit In 2026
 Andrii Romasiun
Founders burn millions scaling companies that lack an audience. Building features without confirming demand drains cash and alienates early adopters. Knowing how to measure product market fit prevents this capital burn. Track user retention and gauge customer sentiment before increasing your marketing budget.
Measuring Product-Market Fit in 2026
The Cost of Premature Scaling
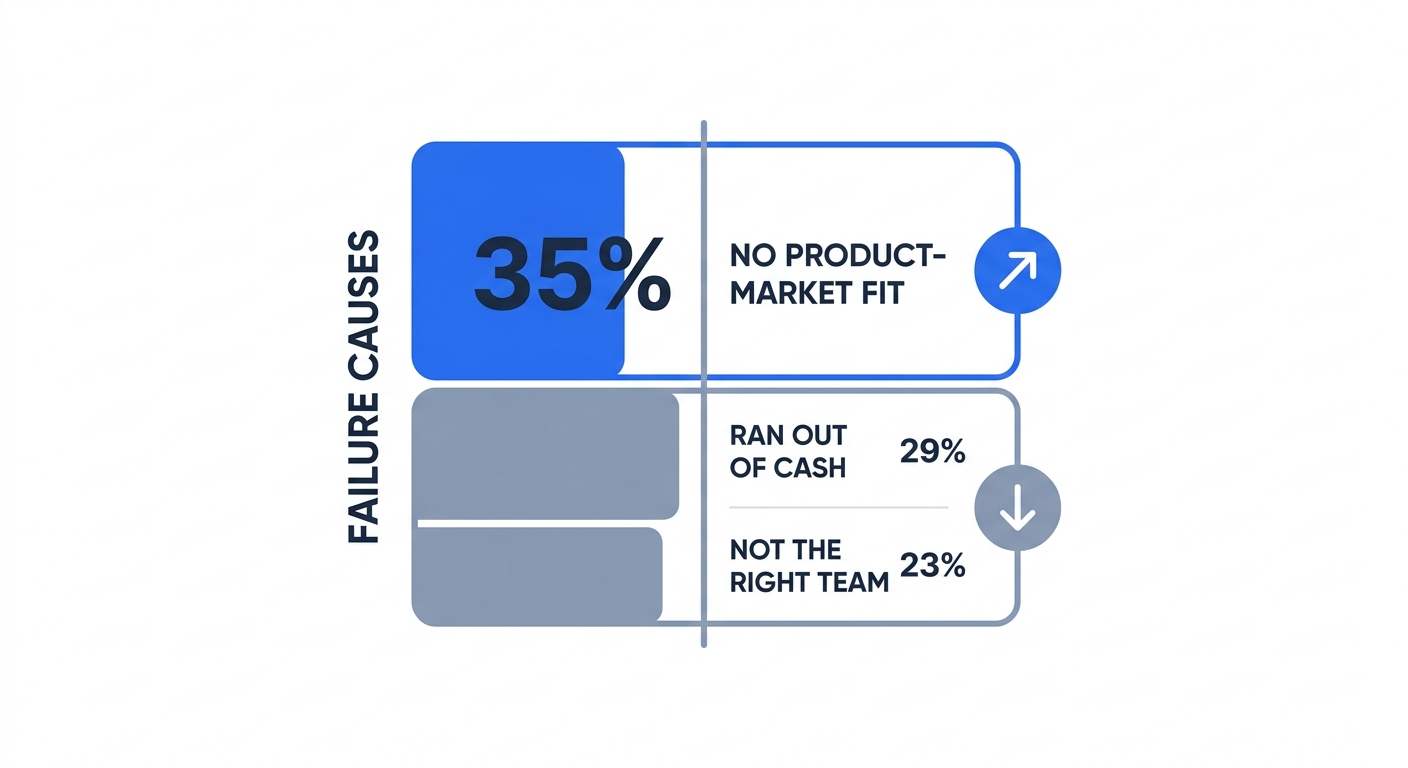
Building a product nobody wants destroys companies. Analysts at CB Insights found 35% of startups end operations because they lack market demand. Founders often confuse a spike in initial signups with long-term viability. Hiring sales teams and buying ads accelerates the burn rate instead of driving sustainable growth.
Wait for concrete retention signals before hiring a growth team. Qubit Capital researchers found that only 11% of seed-funded startups from 2020 reached Series A by 2025. Premature scaling caused most of these casualties. Reaching strong product-market fit takes four to six years of iteration on average.
Defining False Signals vs. True Fit
High traffic volume creates false confidence. A viral launch on Hacker News brings thousands of visitors, but most abandon the site within seconds. Strong registration rates prove your landing page copy works while revealing nothing about the product itself.
Product-market fit requires repeat usage. Active users return without prompting, complain during server downtime, and refer colleagues to the platform.
The Shift to Privacy-First Measurement
Measuring product-market fit requires precise user behavior data. Past playbooks relied on third-party cookies to track users across the web. Regulators enforcing strict GDPR standards make those legacy methods obsolete.
Founders must adopt privacy-first tools to remain compliant. Intrusive cookie banners disrupt the user experience and skew datasets when visitors decline tracking. Switch to cookieless analytics to gather accurate cohort data. Anonymous identifiers allow teams to map the user journey without harvesting personal identifiable information.
The Sean Ellis Test: The Qualitative Benchmark
Understanding the 40% Rule
Teams track behavior through product analytics and sentiment through qualitative feedback. The Sean Ellis survey offers a pass/fail metric for customer sentiment.
Send active users a single question: "How would you feel if you could no longer use this product?"
Provide three choices:
- Very disappointed
- Somewhat disappointed
- Not disappointed
Count the "Very disappointed" responses. Using the Sean Ellis methodology, surpassing the 40% threshold confirms sustainable product-market fit. Scoring below 40% means customers view your product as a nice-to-have commodity. Keep the wording identical and avoid adding a fourth option.
Interpreting Your Survey Scores
Different scores demand different actions. Categorize your results to plan your next development cycle.
| Score Range | Diagnosis | Action Required |
|---|---|---|
| 0% - 20% | No Fit | Pivot the core offering. Revisit customer discovery. |
| 21% - 39% | Near Fit | Focus on the segment that answered "Very disappointed." Build features for them. |
| 40%+ | Product Market Fit | Shift focus to scaling acquisition and optimizing onboarding. |
Gathering Qualitative Data Without Tracking Pixels
Identify active users without violating user trust. Define "active" as anyone who used the core feature twice in the past two weeks. Pull this list from your backend database to avoid frontend tracking pixels.
Email the survey from a human address using a plain-text format. If a user clicks "Very disappointed," trigger an automated follow-up requesting a 15-minute feedback call. Ask them what exact problem your tool solves. Paste their exact quotes into your landing page copy.
Customers who select "Somewhat disappointed" represent your biggest opportunity. Ask them what holds the product back to uncover friction points in your user experience.
Tracking Retention and the Aha! Moment
Visualizing a Flattening Retention Curve
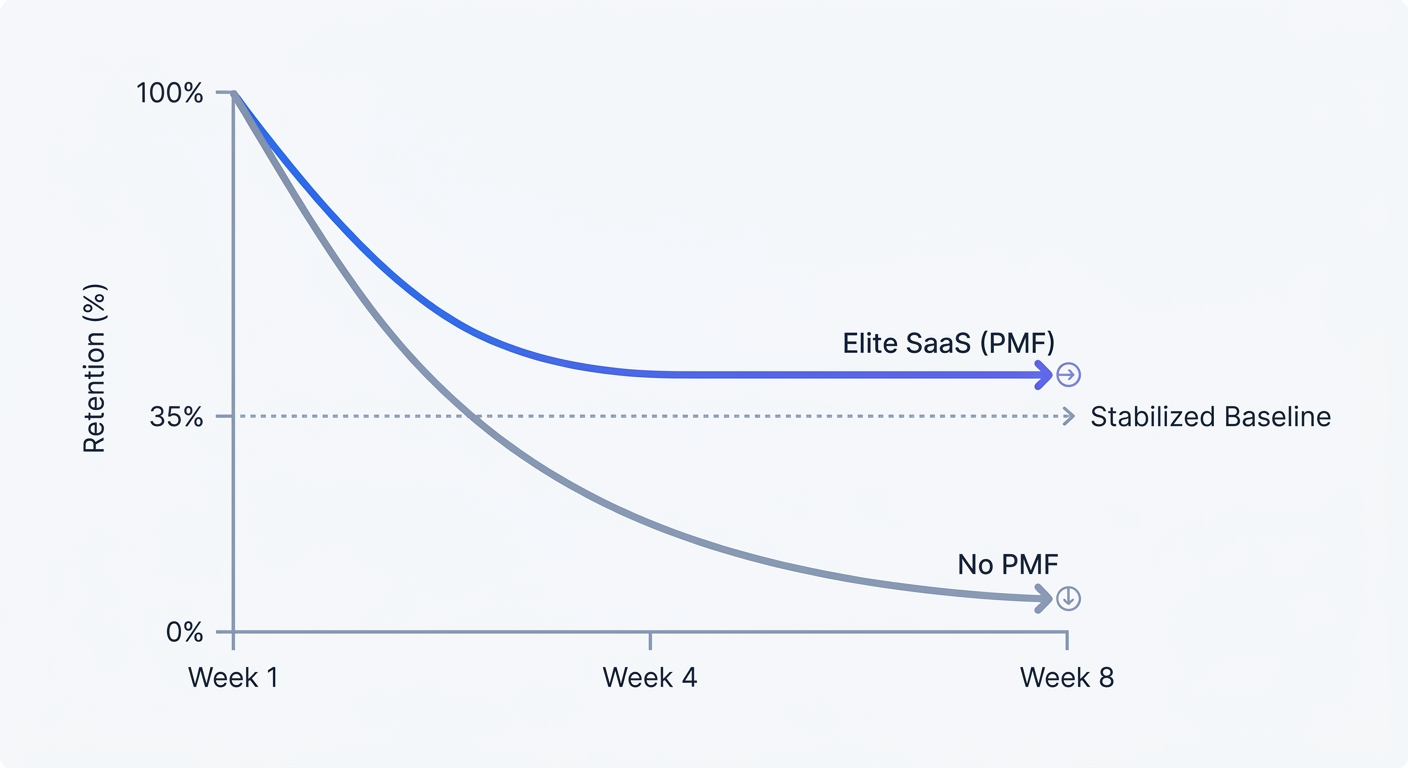
Founders extend business lifespans through strong retention. Building a flat retention curve offers the strongest behavioral indicator of product-market fit.
Plot your user cohorts on an eight-week timeline. If the graph drops to zero over two months, customers see no ongoing value. When the initial curve drops and then stabilizes, it forms a horizontal line. This plateau contains the segment of users who built a habit around your software.
Compare your plateau against benchmarks from Mixpanel. Base expectations on your specific industry.
| Industry Segment | Average 8-Week Retention | Elite 8-Week Retention |
|---|---|---|
| Cross-Industry | 6% - 20% | 25%+ |
| Media & Finance | 15% | 25%+ |
| B2B SaaS | 20% | 35%+ |
| Ecommerce | 10% | 35%+ |
To prove fit, B2B SaaS platforms must clear a 35% eight-week retention rate. Track your monthly churn alongside this eight-week window. Operators of average SaaS products achieve a 92% to 97% monthly retention rate, though enterprise tools typically see higher retention than applications targeting small businesses. Keep monthly churn below 3% to scale without burning capital.
Defining Your Aha! Moment
Users stick around upon experiencing an "Aha!" moment. Pinpoint the specific action delivering core value. People using a project management tool gain value upon assigning their first task to a teammate. Accounting app customers reach activation upon generating their first invoice.
Map the path to this moment, count the required steps, and eliminate friction in the workflow.
Event Tracking Without Intrusive Cookies
Configure custom events in an analytics platform to monitor activation. You can capture this interaction without writing a third-party cookie to the browser.
Add a data attribute to the target button in your markup:
<button swetrix-event="invoice_generated">Generate Invoice</button>
Monitor the conversion rate between account creation and this activation milestone. If you see high signups but zero event triggers, your onboarding sequence requires immediate attention. Completion of the activation event drives long-term retention.
Test your event tracking configuration before launching traffic campaigns. With clean data streams, you can group users by behavior. Compare the retention rate of users who triggered the milestone against those who skipped it. This contrast reveals the financial impact of your activation step.
Using Cohort Analysis for Feature Releases
Engineering teams impact retention with every product update. Run cohort analysis to isolate the effect of these changes.
Launch a new dashboard feature in Week 5, create a cohort of users acquired in Week 6, and compare their retention curve to users acquired in Week 4.
Observing a noticeable lift in the Week 6 retention rate validates the new dashboard investment. Flat or negative changes confirm the feature failed to provide core value. Delete features that fail to improve retention. Excess code slows down the application and confuses new prospects during onboarding. Ruthless pruning keeps the product focused on high-value actions.
Revenue and Growth Metrics for Scaling
The LTV to CAC Ratio Gold Standard
Founders use financial metrics to confirm behavioral trends. Measuring product-market fit requires tracking the cost of acquisition.
Calculate Customer Acquisition Cost (CAC) by dividing total marketing and sales spend by the number of new customers acquired in that period. Find Lifetime Value (LTV) by multiplying average monthly revenue per user by the gross margin, then dividing by the monthly churn rate. Use an LTV calculator to speed up this mathematical process.
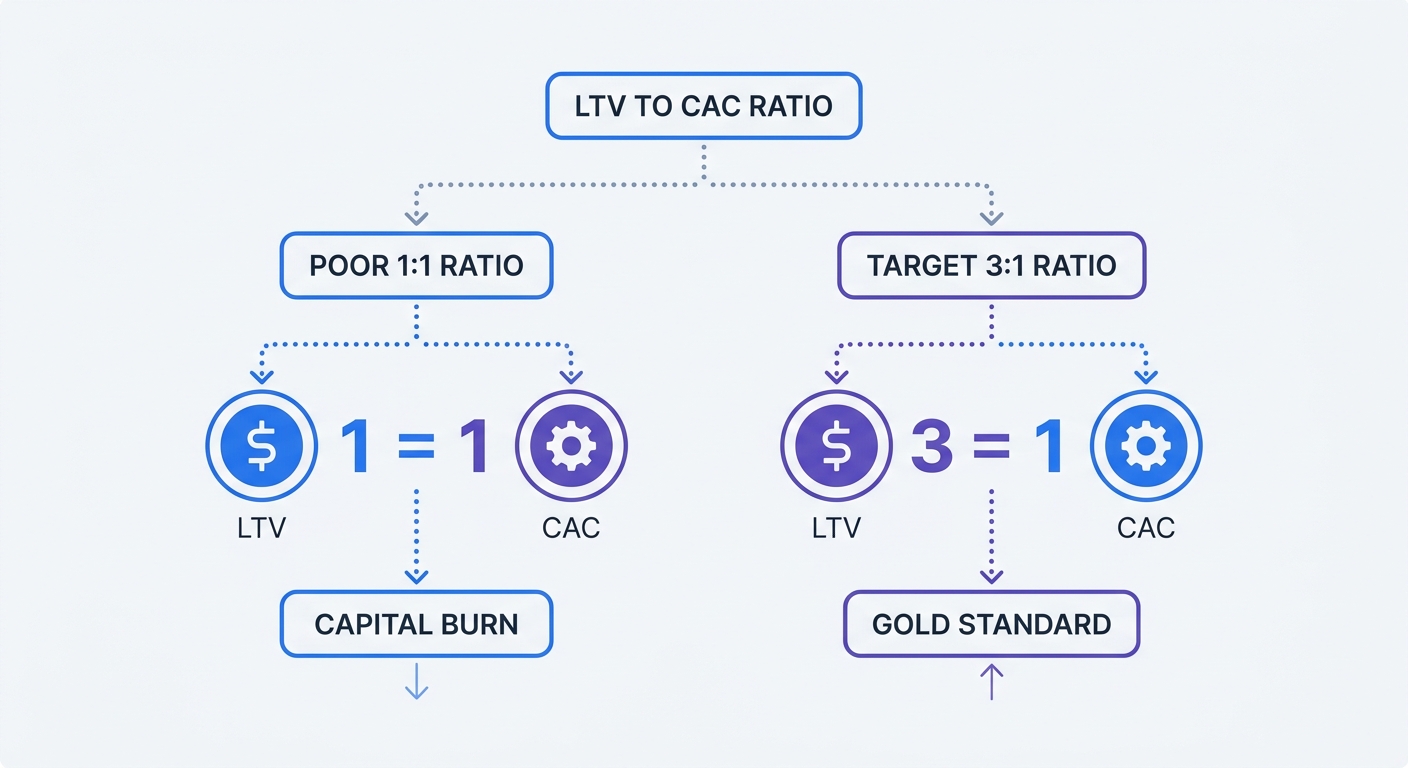
Compare the final two numbers. Operating at a 1:1 ratio destroys capital because you spend a dollar to make a dollar. Wait to scale your ad budget until achieving a 3:1 LTV to CAC ratio. Investors expect three dollars of lifetime value for every acquisition dollar spent. Reaching this benchmark proves your business model sustains independent growth.
A Concrete LTV to CAC Calculation
Run the numbers for a hypothetical software company. Spending $10,000 on ads to acquire 100 new users yields a $100 CAC.
Assume each user pays $50 per month. Applying an 80% gross margin means the business keeps $40 of that revenue. Factor in a monthly churn rate of 5%.
Dividing $40 by 0.05 produces an LTV of $800.
Comparing the $800 LTV to the $100 CAC creates an 8:1 ratio. These founders possess strong product-market fit and should increase their marketing spend.
Reverse the scenario. Spending $5,000 to acquire 10 users creates a $500 CAC. If users pay $20 per month with a 10% churn rate, LTV drops to $200. This 0.4:1 ratio means the company burns cash with every new signup. Halt all marketing campaigns and focus engineering efforts on fixing the product experience.
The Rule of 40 for B2B SaaS
Mature SaaS teams use the Rule of 40 to evaluate sustainable operations. Add your year-over-year growth rate percentage to your profit margin percentage. Scoring 40 or higher indicates a healthy balance between expansion and profitability.
A startup achieving 60% growth with a negative 20% profit margin scores a 40. A slower organization balancing 20% growth and a 20% profit margin also hits the 40 mark. Leaders in both scenarios demonstrate sustainable product-market fit at different stages of the corporate lifecycle.
Net Promoter Score Benchmarks
Run Net Promoter Score (NPS) surveys to gauge recommendation intent. Ask users to rate the likelihood of recommending your product on a zero to ten scale.
Segment the responses:
- Promoters: Scores 9 and 10
- Passives: Scores 7 and 8
- Detractors: Scores 0 through 6
Subtract the percentage of detractors from the percentage of promoters. Achieving an NPS above 50 provides a strong signal of exceptional fit. Recording scores between 30 and 50 reveals early momentum, though baseline expectations vary widely across different industries. Pair these quantitative metrics alongside qualitative Sean Ellis surveys to validate user sentiment.
Base your primary metric on the underlying business model. B2B software teams rely on monthly retention. Ecommerce operators track repeat purchase rates. Consumer social app developers measure daily active users. Pick the measurement standard that aligns with how customers consume value.
Building a Cookieless Analytics Stack
Ditching Legacy Analytics and Consent Banners
Installing heavy tracking scripts slows down your application. Relying on bloated tools requires complex setups and forces teams to implement disruptive consent banners. Displaying these banners lowers conversion rates and creates data blind spots when visitors decline tracking.
Build trust by abandoning third-party cookies. Install a privacy-focused analytics alternative to track pageviews, bounce rates, and user flows. Analyzing clean cohort data uncovers which traffic sources produce retained users. Teams can identify funnel drop-off points without compromising user privacy.
Modern analytics platforms use anonymized identifiers to track unique visits. The system drops the data after a short window. This architectural approach guarantees GDPR compliance by default.
Defining Custom Conversion Funnels
Teams use funnels to track the user journey from arrival to activation. Build a custom funnel to locate the exact step where customers abandon the application.
Map the distinct stages:
- Landing Page Visit
- Pricing Page View
- Account Creation
- First Login
- Core Action Triggered
Track the completion rate between each step. Observing a massive drop-off between account creation and the first login indicates a broken confirmation email. High abandonment between the first login and the core action reveals a confusing user interface.
Fix the transition with the highest drop-off rate. Ignore the rest of the funnel until plugging the biggest leak. Shipping minor improvements in the middle of the workflow generates massive revenue gains at the final conversion point.
Accelerating the Build-Measure-Learn Cycle
Finding product-market fit requires testing multiple hypotheses. Implement new features, monitor usage metrics, and collect user feedback in rapid cycles.
Developers compress this timeline using artificial intelligence. Prototype interfaces with code generation models to push updates within hours. Measure the behavioral impact using product analytics. Discard updates that fail to move the retention needle.
Keep the analytics dashboard simple by tracking three to five core events. Tracking too many variables distracts founders from the primary goal of user activation. Focus on the few metrics proving customers extract value from the software.
Auditing Your Current Setup
Audit the tracking configuration to ensure data accuracy. Verify that scripts load without throwing console errors. Monitor an error tracking dashboard to spot broken flows before bugs corrupt the conversion datasets.
Review the UTM parameter structure. Tag inbound links to attribute external traffic to the correct source. Rely on a standardized URL generator to maintain consistent naming conventions across all marketing campaigns. By organizing traffic data, marketers can calculate acquisition costs with confidence.
Page Performance and User Activation
Delivering slow load times destroys retention before prospects ever experience the core offering. Shipping a broken frontend interface masks existing market demand.
Monitor application speeds using performance tracking software to measure Time to First Byte (TTFB) and Largest Contentful Paint (LCP). Serving massive JavaScript bundles delays page interaction. If the primary call-to-action takes four seconds to become clickable, visitors will abandon the session.
Optimize web assets by compressing images and deferring non-critical scripts. Building a responsive interface eliminates friction during the onboarding process. Eliminating these technical barriers gives users a fair chance to reach the activation milestone.
Stop guessing about user retention. Build a privacy-first analytics stack to measure your product-market fit metrics without annoying cookie banners. Try Swetrix free for 14 days and get clear, actionable data on your next feature launch.