- Date
How To Measure Content Marketing ROI In 2026
 Andrii Romasiun
Content marketing delivers an average return of $7.65 for every $1 spent. B2B companies see a baseline return ratio of 3:1, while email campaigns generate up to $42 per dollar invested. Video marketing increases returns by 49 percent over text formats. Companies publishing 16 or more blog posts a month capture 4.5 times more leads than competitors. You commit budget to content to capture this massive financial upside.
A gap exists between publishing assets and proving their financial value. Thirty-six percent of marketers track returns. Browser restrictions on third-party cookies and global privacy laws like GDPR compound this measurement problem. Invasive tracking methods create legal liabilities for your business. You need a system to measure content marketing ROI using privacy-first analytics tools.
The Content Measurement Gap in 2026
The High Return of Content
You invest time and money into blog posts, videos, and newsletters to drive revenue. Marketers plan to increase content budgets by 69 percent in 2026. Companies with a documented strategy achieve 33 percent higher returns than competitors lacking a formal plan. Tracking these outcomes justifies your spending and defends your budget during financial reviews.
You measure content marketing ROI to identify your most profitable channels. Assigning a dollar value to every blog post allows you to compare revenue against production costs. This financial data dictates how you allocate your next marketing budget to campaigns that generate sales.
You build an appreciating asset when you publish content. You lose traffic the minute you pause your ad spend, whereas you capture new leads from a high-ranking blog post for years. Measuring this long-term value reveals the complete financial impact of your marketing efforts. You track cohort data over a six-month horizon in tools like Google Analytics or Swetrix to monitor early content interactions turning into signed contracts.
The Death of Third-Party Cookies
Safari and Firefox block third-party cookies by default. Global privacy laws impose massive fines for tracking users without explicit consent. Relying on invasive scripts to follow users across the web introduces unnecessary risk. Adapting your tracking methods ensures survival in the current regulatory environment.
You build your measurement strategy on first-party and zero-party data to track actions on your website. Trying to identify individual users across different domains creates compliance issues. Measure button clicks, form submissions, and pageviews using tools built for the modern web. This approach respects user privacy while gathering the numbers required for your ROI formula.
Marketing teams relied on third-party cookies to map user journeys. An advertiser placed a cookie on a user's browser after an ad click to track them across other websites. Developers update modern browsers to intercept and destroy these tracking mechanisms. Depending on outdated technology blinds you to your marketing performance, forcing a transition to cookieless tracking to maintain precise reporting.
How to Measure Content Marketing ROI: The Core Formula
Calculating the True Cost of Content
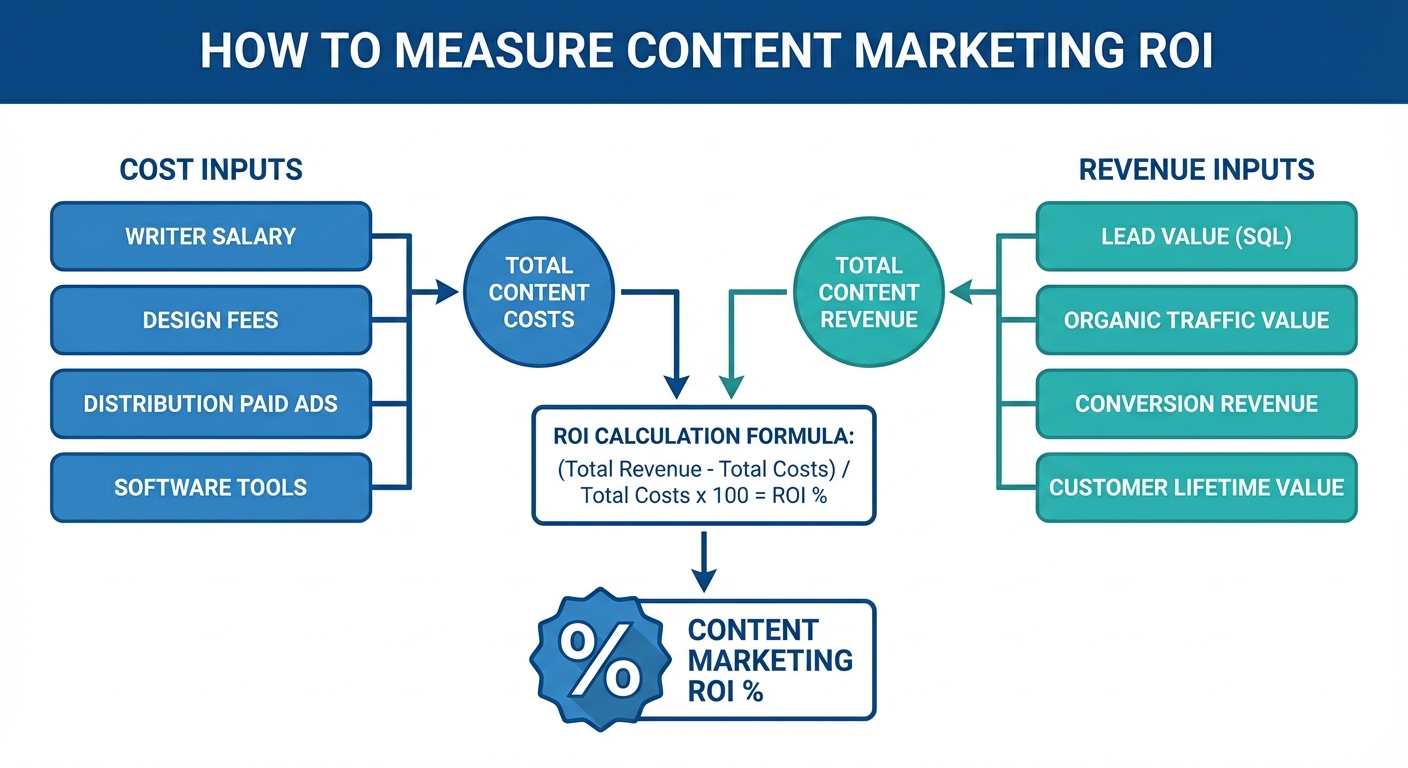
Calculate your return using a standard formula: [(Revenue from Content - Cost of Content) / Cost of Content] x 100. Add up every expense required to produce and distribute your assets. Counting the writer's invoice as your sole expense creates an inaccurate baseline.
Determine your total costs using these specific inputs:
- Production time: Multiply the hourly rate of your writers and editors by the hours spent on a piece.
- Software and assets: Add the monthly cost of design tools, CMS hosting fees, and stock photo subscriptions.
- Distribution: Include paid social promotion and press release syndication fees.
- External expertise: Factor in consulting fees for subject matter experts interviewed for your content.
Total these numbers to find your baseline cost. A blog post costs $1000 when you add $400 for the writer, $150 for the editor, $200 for custom graphics, and $250 for paid promotion. Document these costs in a central spreadsheet, updating the figures every quarter to account for software price increases or changes in freelancer rates.
Defining and Tracking Revenue
Assign a dollar amount to every user action to calculate the revenue side of the formula. E-commerce teams trace a purchase direct to the referring blog post. B2B purchases take months to close, requiring you to assign monetary values to micro-conversions to model your pipeline revenue.
Review your past sales data to pinpoint conversion rates. Finding that 2 out of 100 eBook downloaders become paying customers with an average lifetime value of $5000 means 100 downloads generate $10,000. You assign a value of $100 to every eBook download to standardize your reporting.
Apply this math to a specific campaign. Publishing a whitepaper costing $1000 to produce and tracking 50 downloads yields $5000 in generated value. Plug these numbers into your formula: [(5000 - 1000) / 1000] x 100. Your campaign achieves a 400 percent return on investment.
| Micro-Conversion | Lead to Customer Rate | Customer Lifetime Value | Assigned Event Value |
|---|---|---|---|
| Newsletter Signup | 1% | $1000 | $10 |
| eBook Download | 2% | $5000 | $100 |
| Webinar Registration | 5% | $5000 | $250 |
| Demo Request | 20% | $5000 | $1000 |
Tracking Metrics Beyond the Last Click
Measuring the Zero-Click Era
Users find answers on the search results page via Google's AI Overviews and snippet features. Two-thirds of searches end without a user clicking a link. Measuring content success on pageviews guarantees an incomplete picture. Track brand impressions and share of voice to capture top-of-funnel value.
Measure search engine impressions using Google Search Console to monitor branded search volume. Open your analytics dashboard to measure engaged time, tracking the exact seconds a user spends reading your article. These metrics demonstrate content impact regardless of declining outbound clicks.
You build content to answer queries without friction. A user reads your summary in an AI Overview and leaves without visiting your website. Capture value by ensuring your brand name appears next to the answer. Track these zero-click appearances as top-of-funnel brand impressions, correlating spikes in these impressions with direct website traffic increases later in the month.
Leading vs. Lagging Indicators
Divide your metrics into two categories to evaluate performance. Review leading indicators for early signs of success. Track lagging indicators to see the financial payoff.
Monitor leading indicators to optimize live campaigns:
- Engaged time: Measure active reading moments through heartbeat pings in your analytics tool.
- Scroll depth: Track the percentage of users who read past the first paragraph.
- Bounce rates: Monitor the percentage of visitors leaving your site without taking action.
Measure lagging indicators at the end of your sales cycle:
- Cost Per Lead: Divide total content costs by the number of leads generated.
- Customer Acquisition Cost: Measure the total marketing spend required to win one paying customer.
- Customer Lifetime Value: Calculate the total revenue a customer generates during their relationship with your business.
Check your leading indicators every morning to catch technical errors or poor formatting. Finding a 90 percent bounce rate on a new article prompts you to open the page and fix a broken image. Review your lagging indicators every quarter to make budget allocation decisions.
Using Privacy-First Analytics and Swetrix
Cookieless Event-Based Tracking
You need a privacy-focused analytics platform to measure content marketing ROI without violating user trust. We built Swetrix to capture performance metrics without deploying third-party cookies. Track user behavior without triggering intrusive cookie consent banners.
Focus your measurement on events rather than identities. Configure your analytics to register specific actions, tracking an eBook download or a pricing page visit as an anonymous event.
Set up a custom event in Swetrix to track a newsletter signup:
- Open your Swetrix dashboard and navigate to the Events section.
- Create a new event and name it
newsletter_signup. - Add a tracking snippet to your form submission button.
- Insert this code:
<button onclick="swetrix.track('newsletter_signup')">Subscribe</button>. - Submit a test form to verify the event fires in your dashboard.
Gather conversion data while keeping user identities anonymous. Measure the effectiveness of your content marketing without collecting personal data to guarantee GDPR compliance.
The Advantage of Server-Side Validation
Users deploy browsers and ad blockers to intercept traditional tracking scripts. Relying on client-side tracking costs you up to 40 percent of your data. This data loss forces you to make poor budget decisions based on incomplete metrics.
Implement server-side tracking to solve this problem. Send data from your server to your analytics platform to bypass browser restrictions and ad blockers.
Marketing teams at B2B companies report a 41 percent improvement in data quality after implementing server-side tracking. Base your ROI calculations on reliable visitor counts and conversion numbers. Configure Swetrix to handle server-side tracking for your high-value conversion events.
Client-side tracking mimics handing a note to a messenger. Users install ad blockers to stop the messenger from delivering the data. Server-side tracking operates like a secure private phone line. Dial the analytics platform from your own infrastructure to bypass the ad blocker. Record every demo request and newsletter signup without interference.
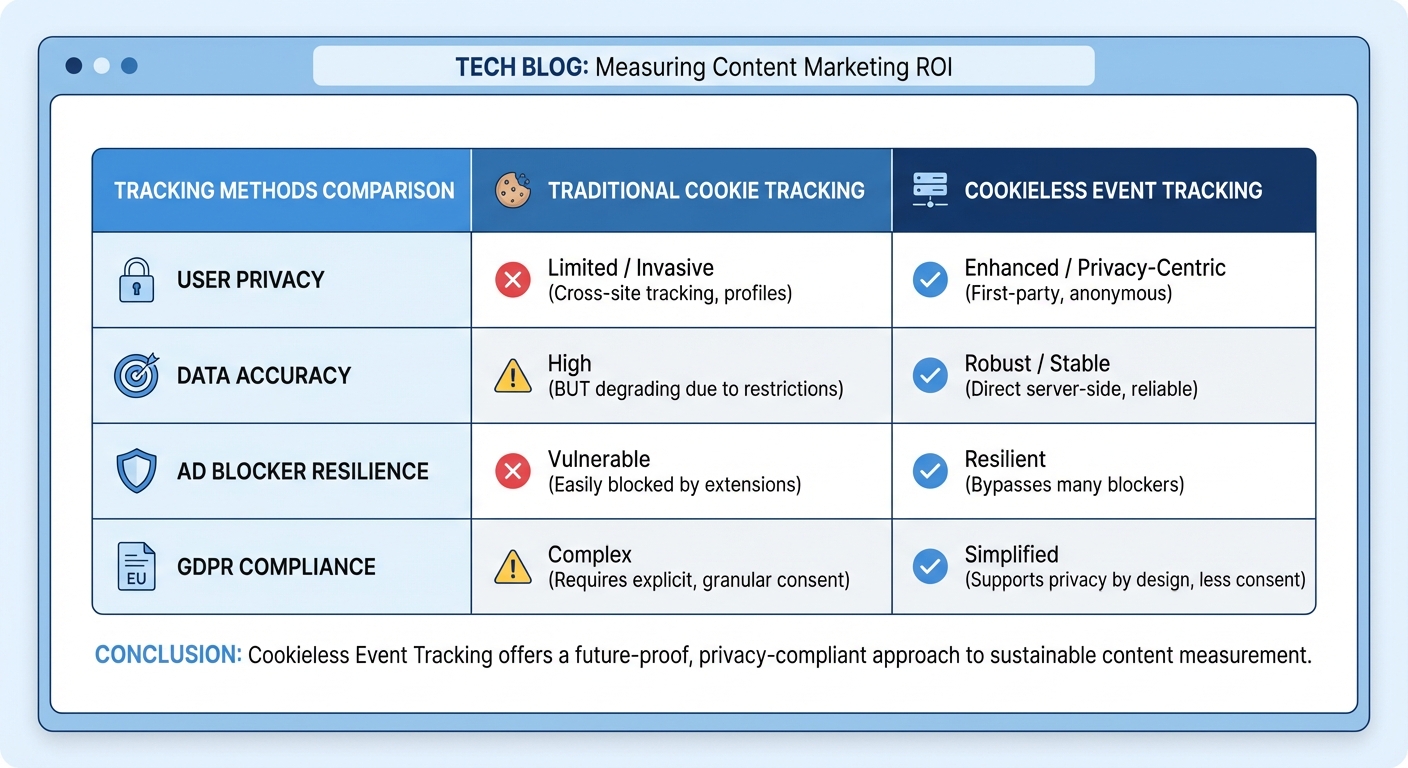
| Feature | Traditional Analytics | Privacy-First Analytics (Swetrix) |
|---|---|---|
| User Tracking | Follows individual identities across sites | Tracks anonymous actions and events |
| Consent Popups | Requires intrusive cookie banners | Operates without cookie banners |
| Data Capture | Blocked by default on most browsers | Captures data via server-side tracking |
| Compliance | Requires constant legal updates | GDPR and CCPA compliant by design |
Connecting Cookieless Data to Pipeline Revenue
Measuring Organic Traffic Value
Top-of-funnel blog posts lack a direct tie to closed revenue. Measure the financial impact of this content using Organic Traffic Value. Calculate the equivalent cost of buying your organic traffic through search ads in Google Keyword Planner.
Identify the primary keyword for your blog post. Open an SEO tool like Ahrefs to find the Cost Per Click for that keyword, and multiply the CPC by your monthly organic visitor count.
Publish an article bringing in 2000 visitors every month. If the target keyword costs $2 per click on Google Ads, you generate $4000 in equivalent ad value. Compare this $4000 value against the $500 cost to produce the article to prove the financial worth of your top-of-funnel content.
Apply this metric to your entire content library to identify outdated posts generating high Organic Traffic Value. Prioritize updating these posts to protect your organic traffic. Maintaining high search rankings saves thousands of dollars in advertising spend.
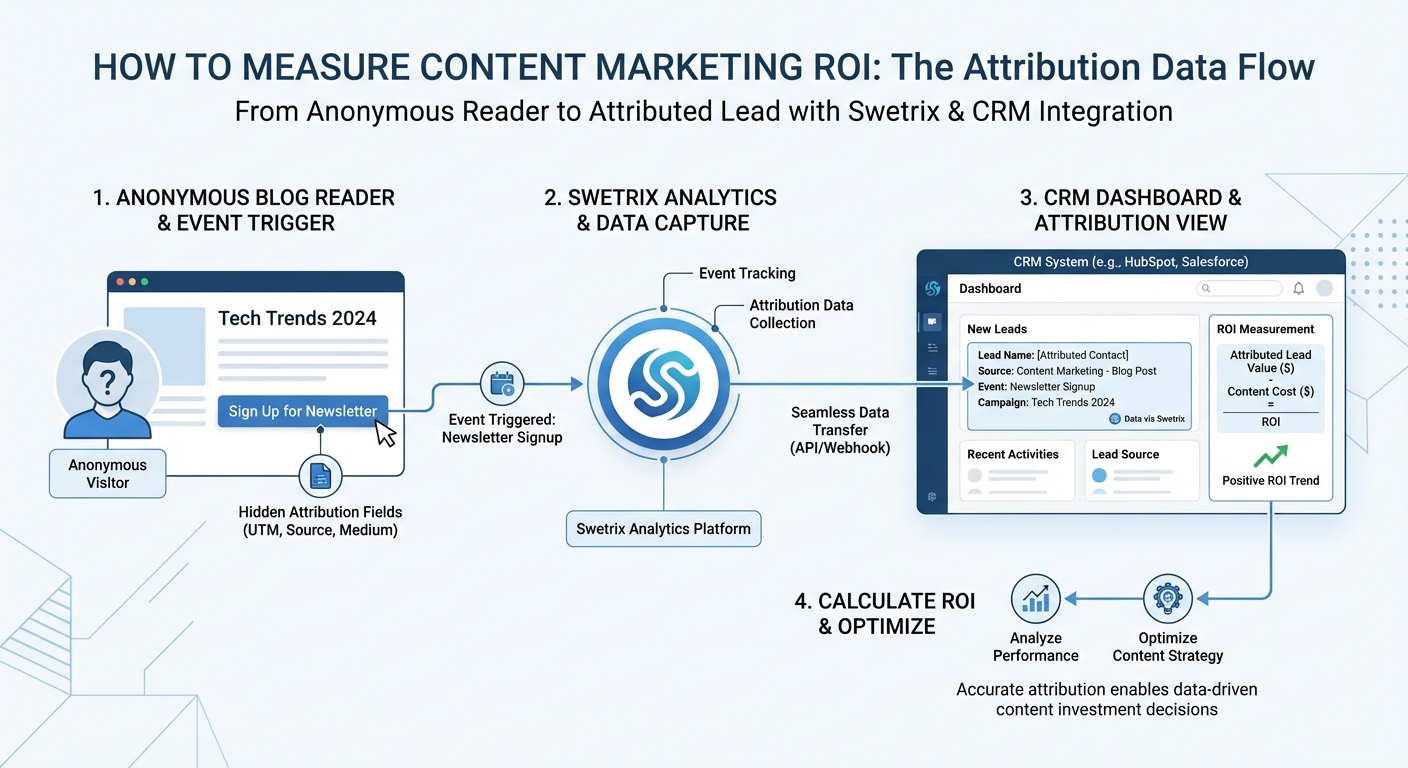
Integrating Analytics with Your CRM
Connect your website analytics to your customer relationship management software to bridge the gap between anonymous web traffic and pipeline revenue. Use hidden fields on your lead capture forms to pass attribution data.
Add hidden input fields to your demo request form to capture the specific marketing campaign using UTM parameters. Write a short JavaScript function to grab the parameter from the URL.
// Grab the UTM source from the URL
const urlParams = new URLSearchParams(window.location.search);
const source = urlParams.get("utm_source");

// Populate the hidden field in your form
document.getElementById("hidden_utm_source").value = source;
Send this data to your CRM upon form submission to create a closed-loop reporting system. Open your CRM to see a specific whitepaper generated five enterprise leads, and review the revenue those leads produced. Match that CRM revenue data with the engagement metrics in Swetrix to calculate your content marketing ROI.
Identify your highest converting assets. Funnel more production budget into the topics driving the largest CRM deals while pausing spend on content formats generating traffic but zero pipeline revenue. This financial data turns your content strategy into a predictable marketing engine.
Ready to track your content performance without compromising user privacy? Start your free trial of Swetrix and build your cookieless tracking system.