- Date
A Guide to Customer Retention Metrics
 Andrii Romasiun
Customer retention metrics are simply the numbers that tell you how good you are at keeping your customers. Think of them as the vital signs for your business—they measure customer loyalty, happiness, and the overall strength of your relationship with the people who buy from you.
These metrics answer a critical question: Are our customers sticking around, or are they quietly heading for the exit?
Why Retention Metrics Are Your Growth Engine
It’s easy to get caught up in the chase for new customers. That feels like progress, right? But the real secret to building a business that lasts is holding on to the customers you’ve already won over.
Imagine your business is a bucket you're trying to fill with water (your customers). Pouring new customers in is great, but if your bucket is riddled with holes, you're just leaking revenue and potential. Customer retention metrics are how you find and plug those holes.
These numbers aren't just for the support team, either. They're strategic guideposts for everyone, from marketing and sales to product development, because they directly tie into profitability and long-term health.
This infographic paints a clear picture of how keeping customers feeds directly into a healthier, growing business.
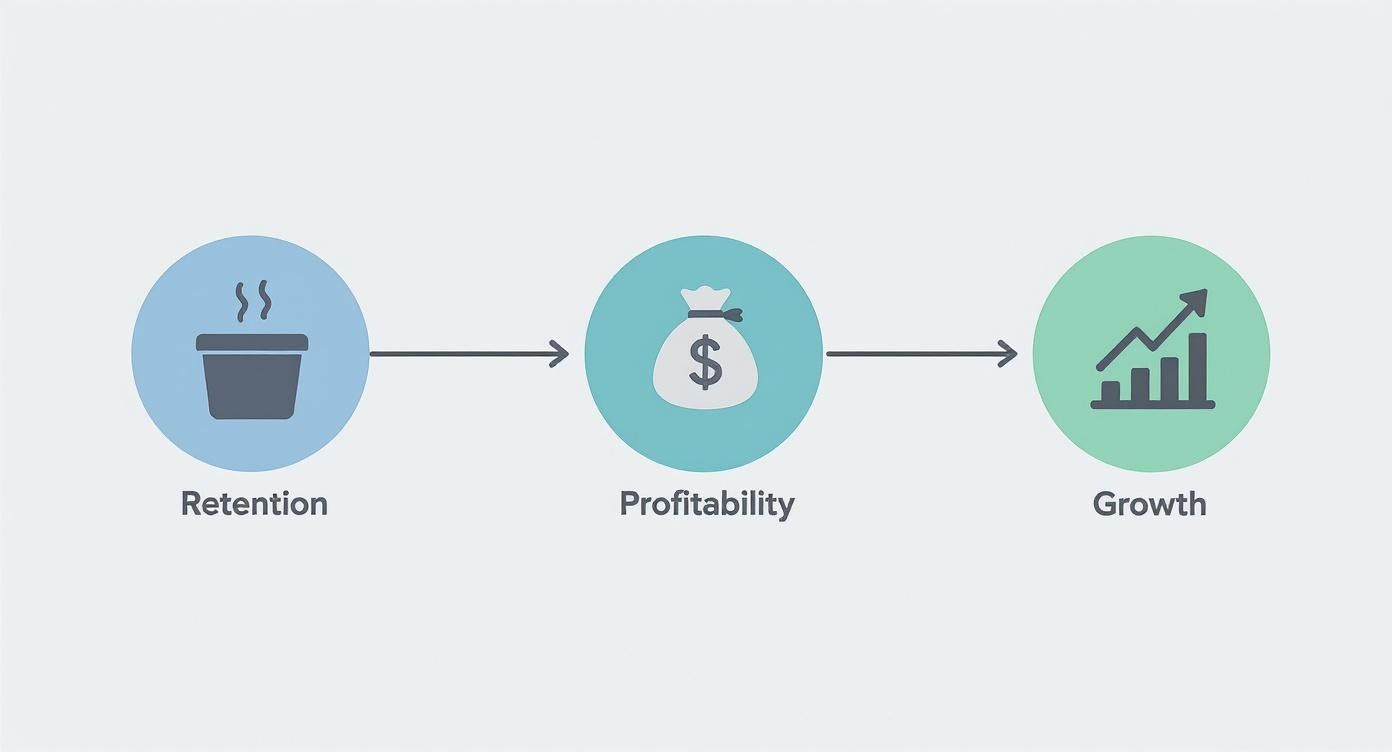
As you can see, plugging those leaks is one of the most effective ways to improve your bottom line.
Before we dive deep into each metric, here’s a quick overview of the key players we’ll be discussing. This table will serve as our roadmap for the rest of the guide.
Key Customer Retention Metrics at a Glance
| Metric Name | What It Measures | Why It's Important |
|---|---|---|
| Customer Retention Rate | The percentage of customers who stay with you over a period. | It's the ultimate measure of customer loyalty and business health. |
| Customer Churn Rate | The percentage of customers who leave over a period. | It helps you identify and fix the reasons why customers are leaving. |
| Customer Lifetime Value (CLV) | The total revenue you can expect from a single customer. | It helps you understand the long-term value of your customers. |
| Repeat Purchase Rate | The percentage of customers who buy from you more than once. | It's a strong indicator of customer satisfaction and product-market fit. |
This table sets the stage, but the real power comes from understanding how to calculate, interpret, and act on these numbers.
The Financial Power of Loyalty
The financial upside of focusing on retention is staggering. Research has shown that a mere 5% increase in customer retention can boost company profits by a stunning 25% to 95%.
That massive range highlights how much this varies by industry, but the takeaway is universal: keeping customers happy pays for itself, many times over. If you want to dig into more stats, you can find a great breakdown of the value of customer loyalty on firework.com.
Beyond Numbers to Strategy
At the end of the day, these metrics aren't just about getting a performance score. They give you a clear roadmap for what to do next.
- Pinpoint Friction: A high churn rate might be screaming that your onboarding process is confusing or a key feature is buggy.
- Identify Champions: Metrics like Customer Lifetime Value (CLV) shine a spotlight on your most valuable customers. You can then study what makes them successful and replicate it.
- Validate Product-Market Fit: When you see a high repeat purchase rate, you have solid proof that your product is genuinely solving a problem for people.
By keeping a close eye on these key figures, you turn raw customer data from a static report into a dynamic, strategic tool for building a stronger, more profitable business.
Calculating Your Customer Retention and Churn Rates
Before you can improve customer loyalty, you have to measure it. The two most fundamental metrics for this are Customer Retention Rate (CRR) and Customer Churn Rate. Think of them as two sides of the same coin; they provide the clearest, most direct snapshot of your business's health.
They essentially track the "ins" and "outs" of your customer base. CRR shows you how many people stick around, while churn reveals how many are walking out the door. Getting a handle on both is the very first step toward building a more stable and predictable business.
How to Calculate Customer Retention Rate (CRR)
Your Customer Retention Rate is simply the percentage of customers who stay with you over a given time frame. It’s a powerful indicator of how happy people are with your product or service.
A common mistake is to only look at your total customer count at the end of the month. That number can be misleading. CRR is more precise because it's not about how many customers you have in total; it’s about how many of your original customers you managed to keep.
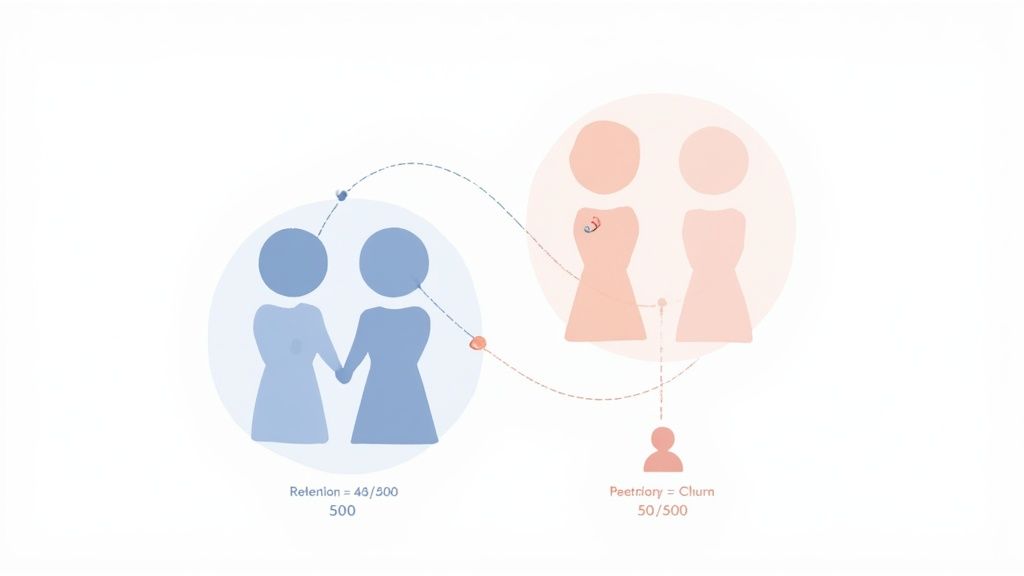
Let's walk through an example. Say you start the month with 500 customers. During that month, you lose 50 but bring in 100 new ones. You end the month with 550 customers, which on the surface looks like solid growth. But your retention rate focuses only on the 450 you held onto from that initial group of 500.
Here’s the formula to figure that out:
CRR = ( (Customers at End of Period - New Customers Acquired) / Customers at Start of Period ) x 100
Using our numbers: ( (550 - 100) / 500 ) x 100 = 90%. So, your Customer Retention Rate for that month is 90%. Now you have a real number you can track and work to improve.
Understanding Customer Churn Rate
Customer Churn Rate is the flip side of retention. It measures the percentage of customers who bailed on you during that same period. If retention is about plugging leaks in a bucket, churn measures how fast the water is draining out. It’s the metric that keeps founders up at night.
Calculating churn is usually a bit simpler than retention, but it’s just as vital for understanding your company's stability. For a more detailed look, you can check out our guide on how to calculate customer churn rate.
The formula is pretty straightforward:
Churn Rate = ( Customers Lost / Customers at Start of Period ) x 100
Let’s apply this to the same scenario. You started with 500 customers and lost 50 over the month.
The math is: ( 50 / 500 ) x 100 = 10%. Your Customer Churn Rate is 10%. You'll notice your retention rate (90%) and your churn rate (10%) add up to a perfect 100%. They are direct opposites.
Interpreting Your Rates
So, you have your numbers. What do they actually mean? A "good" rate is highly dependent on your industry. A B2B SaaS company with annual contracts might shoot for 95% retention and consider anything less a problem. On the other hand, a mobile gaming app might be thrilled with 40% retention after the first month.
The most important thing is to establish your own baseline. Start tracking these metrics consistently—either monthly or quarterly—so you can spot trends and address issues before they spin out of control.
Measuring the True Value of Customer Loyalty
While retention and churn rates give you a quick health check, they don't really tell the full story. To grasp the real, long-term impact of loyalty, you have to dig deeper and measure the actual financial value your customers bring to the table over their entire journey with you.
These more advanced customer retention metrics shift the conversation. You stop asking, "How many customers did we keep?" and start asking, "How valuable are the customers we kept?" That simple change in perspective is key to making smarter decisions about where to put your money—be it in marketing, product development, or customer support.
Unlocking Future Revenue with Customer Lifetime Value
Customer Lifetime Value (CLV or LTV) is, without a doubt, one of the most powerful numbers you can track. It’s a forecast of the total profit you can expect to earn from a single customer for as long as they do business with you.
Think about it this way: a new customer isn't just a one-time transaction. They're an asset, someone who could generate a steady stream of income for months or even years. CLV is how you put a number on that future potential.
There are some seriously complex formulas out there, but you can get a great starting point with a simplified approach:
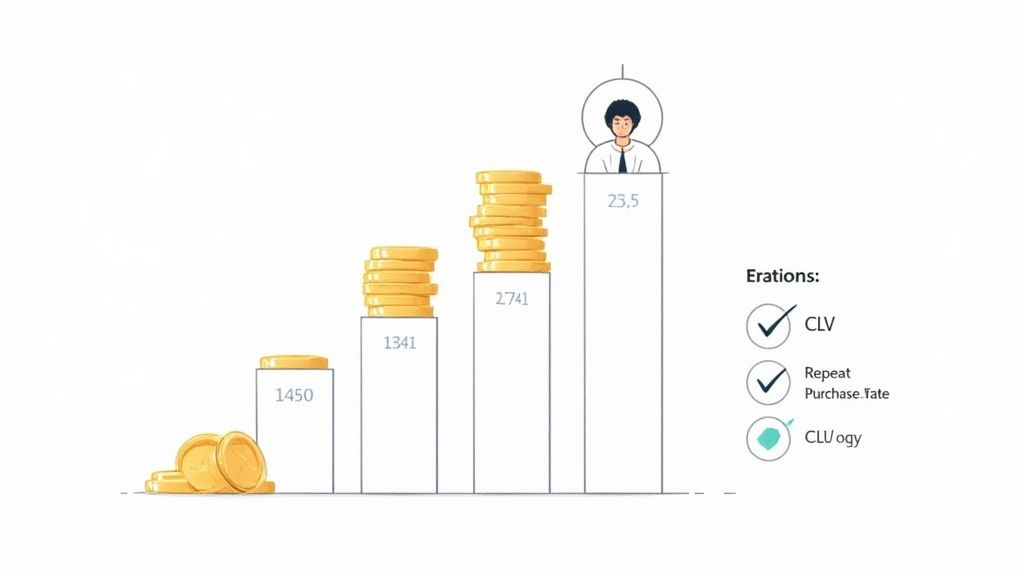
Simplified CLV = (Average Purchase Value) x (Average Purchase Frequency) x (Average Customer Lifespan)
So, if a typical customer spends $50 a month and sticks around for about 24 months, their CLV is a cool $1,200. Once you know that, it suddenly makes a lot more sense to spend a bit more to acquire those high-value customers and invest in keeping them happy.
Tracking Immediate Loyalty with Repeat Purchase Rate
If CLV is the long-term forecast, then Repeat Purchase Rate (RPR) is your immediate loyalty barometer. It's a simple, powerful metric that tells you what percentage of your customers have come back to buy from you again.
A healthy RPR is a fantastic sign that you've achieved product-market fit and that your customers are genuinely satisfied. It means your product is doing what it's supposed to do, and people see enough value to return for more.
Calculating it is straightforward. Just divide the number of customers who have bought more than once by your total customer count.
- Number of customers with 2+ purchases: 200
- Total number of customers: 1,000
- Repeat Purchase Rate: 200 / 1,000 = 20%
When you see your RPR climbing, it's a solid signal that your short-term retention efforts are paying off—and that will eventually feed into a much healthier CLV down the road.
The financial motivation here is huge. Studies show that, on average, existing customers spend about 67% more than new ones, directly pumping up their lifetime value. What’s more, data reveals that 65% of a company's business typically comes from its current customers, proving just how much value is locked away in your loyal base. If you want to dive into the numbers, you can read more about these customer retention statistics.
Gauging Customer Sentiment and Satisfaction
Financial numbers like churn rates and customer lifetime value tell you what your customers did, but they're not great at explaining why. To really get inside your customers' heads, you have to measure how they feel. These qualitative customer retention metrics are your early warning system, giving you a peek into customer happiness and what they might do next.
Think of it like this: your retention rate is the final score of the game. Sentiment metrics are the play-by-play commentary. They clue you into the mood, the momentum, and all the little shifts that ultimately determine who wins. When you start tracking customer satisfaction, you stop just reacting to problems and start getting ahead of them.
Decoding Loyalty with Net Promoter Score
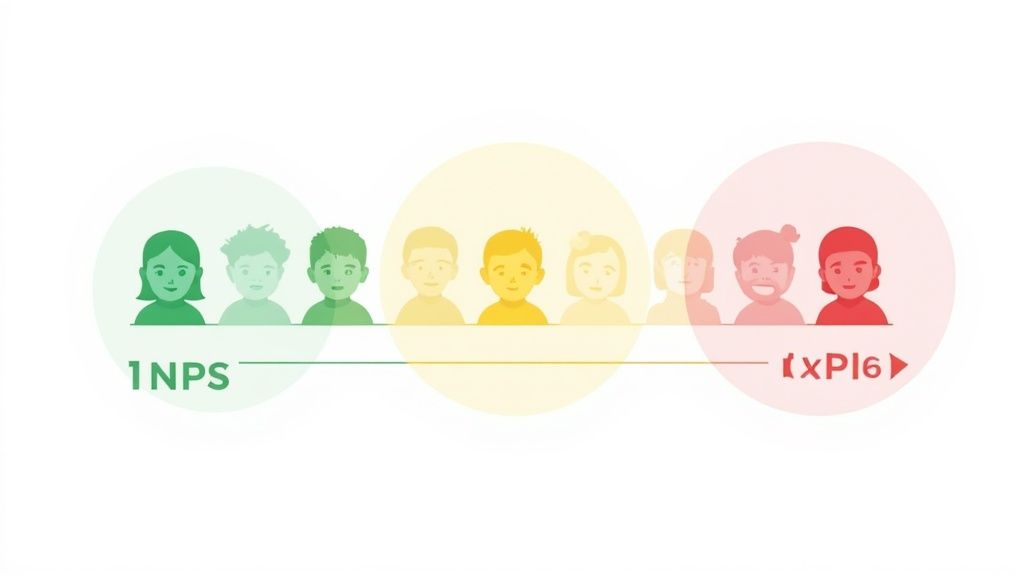
One of the most widely used sentiment metrics is the Net Promoter Score (NPS). It's so popular because it boils everything down to a single, direct question: "On a scale of 0-10, how likely are you to recommend our company to a friend or colleague?"
Based on their answers, customers fall into one of three buckets:
- Promoters (9-10): Your biggest fans. These are the loyal, enthusiastic customers who buy again and again and, more importantly, tell everyone they know about you. They're a massive engine for growth.
- Passives (7-8): These customers are content, but that's about it. They're not unhappy, but they aren't exactly shouting from the rooftops either, which makes them susceptible to a better offer from a competitor.
- Detractors (0-6): These are your unhappy campers. They're at high risk of churning and can actively harm your brand with negative feedback and poor reviews.
Calculating your NPS is straightforward: just subtract the percentage of Detractors from the percentage of Promoters. The final score can range anywhere from -100 to +100 and gives you a clear, high-level snapshot of customer loyalty.
Taking a Real-Time Pulse with CSAT
While NPS is great for gauging long-term loyalty, Customer Satisfaction (CSAT) scores are all about the here and now. CSAT is perfect for taking a real-time pulse check on specific interactions. You'll typically ask, "How satisfied were you with your experience today?" immediately after a key moment, like closing a support ticket or completing a purchase.
A consistently high CSAT score is one of the strongest predictors of low churn. It confirms that you aren't just selling a product but delivering a positive experience at every touchpoint. The real value, however, comes from acting on this feedback.
This is critical because customers have very little patience for bad service. In fact, research from Webex shows that around **70% of customers** will ditch a brand after just two negative experiences. That's not a lot of room for error.
Ultimately, both NPS and CSAT give you the context behind the numbers. They help explain the "why" behind user behavior. To get the full story, you need to combine what customers say with what they do. You can learn more about this in our complete guide to user analytics.
How to Benchmark Your Retention Performance
So, you’ve calculated your customer retention rate. That’s a great first step, but what does that number actually mean?
A 75% retention rate might be cause for celebration if you run a mobile gaming app, but it could be a five-alarm fire for an enterprise SaaS business built on annual contracts. On their own, retention metrics are just numbers floating in a void. They need context to tell you the real story.
This is where benchmarking comes in. It’s the process of comparing your performance against industry standards to answer one critical question: "Are we doing well, just okay, or is there a problem?" This context is essential for setting realistic goals and figuring out where you truly stand.
What Shapes a "Good" Retention Rate?
There's no magic number for a "good" retention rate because every business is different. What works for a B2C e-commerce shop won't apply to a B2B software company. The expected loyalty and churn patterns are shaped by a few key factors.
- Your Business Model: Subscription services like SaaS or streaming platforms are built for loyalty, so their retention expectations are naturally higher than an online store where purchases might be a one-off event.
- The Terms of Your Contracts: It’s a simple but crucial point. A business selling annual contracts will almost always see higher retention than one with a monthly plan, simply because customers have fewer opportunities to leave.
- The Maturity of Your Market: In a brand-new, fast-moving market, customers are often shopping around, so churn tends to be higher. In a more established market, loyalty has had time to take root.
- Your Specific Industry: This is a big one. Customer behavior and expectations vary wildly from one sector to another. For example, you can explore detailed industry-specific retention rates on Exploding Topics.
Let's look at some typical numbers to see just how much this can vary.
Average Customer Retention Rates by Industry
The table below gives you a sense of typical annual retention rates across different sectors. Use it to see where you might fit in, but remember these are just averages—your own model will cause variations.
| Industry | Average Annual Retention Rate |
|---|---|
| Professional Services | 84% |
| Media | 84% |
| IT & Software | 81% |
| Financial Services | 78% |
| SaaS | 77% |
| Automotive & Transportation | 75% |
| Telecommunications | 75% |
| E-commerce & Retail | 63% |
| Hospitality & Restaurants | 55% |
As you can see, a media company holding onto 84% of its customers is hitting the industry standard. But for an e-commerce brand, a 63% retention rate is much more typical, given the transactional nature of retail.
The most important thing to remember is this: you’re not competing against some universal “good” score. You’re competing against the norms and expectations within your specific industry and business model.
Once you understand these nuances, you can stop chasing a generic number and start setting intelligent goals. It allows you to build a retention strategy that's both ambitious and grounded in the reality of your business.
Turning Retention Insights into Action
https://www.youtube.com/embed/LkpPB39UhdQ
Knowing your customer retention numbers is a great start, but it's only half the story. The real magic happens when you use those numbers to build a solid plan that keeps customers happy and your business growing. Your data is basically a roadmap, showing you exactly where your customer experience shines and where it's falling apart.
Think of it like this: a high churn rate after the first month isn't just a scary statistic. It’s a massive red flag screaming that your onboarding process probably needs work. Likewise, a low Net Promoter Score (NPS) isn't just a number; it’s your customers telling you, "Hey, I'm frustrated, and you need to fix this." The goal is to draw a straight line from every metric to a specific, tangible action.
For instance, if your repeat purchase rate is disappointing, maybe it's time to launch a loyalty program that rewards your regulars. If your 90-day retention is low, a well-timed, personalized email sequence could be the key to keeping new users engaged.
Creating a Strategic Action Plan
The best retention plans are proactive, not reactive. They get ahead of customer needs and smooth out bumps in the road before they cause someone to leave. This means mapping out the entire customer lifecycle and pinpointing those make-or-break moments where you can step in and deliver more value. Our guide on customer journey mapping examples is a fantastic place to start building that framework.
Here are a few powerful strategies you can tie directly to your metrics:
- Improve Onboarding: If you're losing users early, your welcome emails and in-app tutorials need to be crystal clear. Guide new customers to that "aha!" moment as quickly as possible.
- Launch a Loyalty Program: Want to boost your Repeat Purchase Rate and CLV? Make your best customers feel like VIPs with exclusive discounts or early access to new products.
- Establish Feedback Loops: To raise your NPS and CSAT scores, you have to ask for feedback—and then actually do something with it. Show customers you're listening by making visible changes based on their suggestions.
Prioritizing Your Efforts
You can’t fix everything at once, so don't even try. Instead, focus your energy where it will make the biggest difference. Start by plugging the "leakiest" part of your customer bucket.
Direct communication is often your most effective tool here. A staggering 89% of companies say email marketing is their primary channel for retaining customers. This just goes to show how powerful consistent, personalized outreach can be.
And don't forget about support. A whopping 60% of consumers say good customer service is what keeps them loyal, making it a non-negotiable investment for any serious retention strategy. You can discover more customer retention insights on Exploding Topics.
Got Questions? We've Got Answers
Diving into customer retention metrics can feel a bit like learning a new language. It's totally normal to have questions as you start putting these numbers to work. Let's tackle a couple of the most common ones that come up.
Think of this as a quick chat to clear up any confusion and help you move forward with confidence.
What’s a Good Customer Retention Rate, Really?
Honestly, there's no universal "good" number that fits every business. What's considered great for one company might be just average for another. It all comes down to your industry.
For instance, businesses in media or professional services often see retention rates around 84%, since they're usually based on subscriptions or long-term contracts. On the flip side, retail and e-commerce brands might see rates closer to 63%. That's perfectly normal, given the one-off, transactional nature of many purchases.
Your best bet? First, see how you stack up against your specific industry's average. But more importantly, focus on beating your own numbers. Your goal should be steady, consistent improvement over time.
Don't get too hung up on hitting a specific industry benchmark. The real win is creating an upward trend in your own retention rate. A rising number, month after month, is the clearest sign you're doing things right.
If I Can Only Track One Metric, Which Should It Be?
If you're just starting out and need to pick one metric to be your north star, make it the Customer Retention Rate (CRR). It’s the most straightforward measure of how well you're keeping the customers you've already earned. It directly answers the big question: "Are people sticking around?"
But here's the thing: no single metric tells the whole story. The real magic happens when you start combining them. For example, looking at your CRR alongside your Customer Lifetime Value (CLV) gives you a much richer picture. It helps you understand not just if customers are staying, but how much they're worth to your business over time.
Ready to stop guessing and start measuring? Swetrix provides the privacy-first web analytics you need to track user behavior, understand your customer journey, and improve your retention. Start your free 14-day trial today.