- Date
Analytics for SaaS Startups: Essential Guide for 2026
 Andrii Romasiun
A SaaS founder checks their dashboard and sees 1,200 monthly active users. Revenue sits at $18,000 MRR. Both numbers climbed 15% last month. The founder celebrates, then wonders: are we growing fast enough? Will we run out of cash before hitting profitability? Which users will churn next quarter?
Standard web analytics tools like Google Analytics track pageviews and sessions. That works for e-commerce sites selling shoes. SaaS operates differently. The sale marks the beginning of the relationship, not the end. Your business model relies on recurring revenue, which means delivering continuous value month after month. A single signup metric tells you nothing about whether users activate, engage, or renew.
Product analytics platforms track behavior inside your application. Web analytics platforms track how visitors find your site and navigate marketing pages. Early-stage SaaS companies need both: marketing analytics to measure acquisition channels and product analytics to measure retention and engagement. Focus on the wrong metrics, and you'll optimize for vanity numbers while missing the signals that predict revenue growth or collapse.
Why SaaS Startups Need Different Analytics
The Recurring Revenue Challenge
Traditional businesses optimize for transaction volume. A retail site wants more purchases. A lead-gen site wants more form submissions. SaaS companies optimize for customer lifetime value across months or years of recurring payments. This difference changes which metrics matter.
Consider two companies with identical $50,000 MRR. Company A grew from $40,000 last month by adding $15,000 in new subscriptions and losing $5,000 to churn. Company B grew from $40,000 by adding $12,000 in new subscriptions and losing $2,000 to churn. Both show 25% growth, but Company B's lower churn rate means it will compound faster over time. The difference becomes obvious at scale: Company A needs to replace 12.5% of revenue every month to stand still, while Company B only replaces 5%.
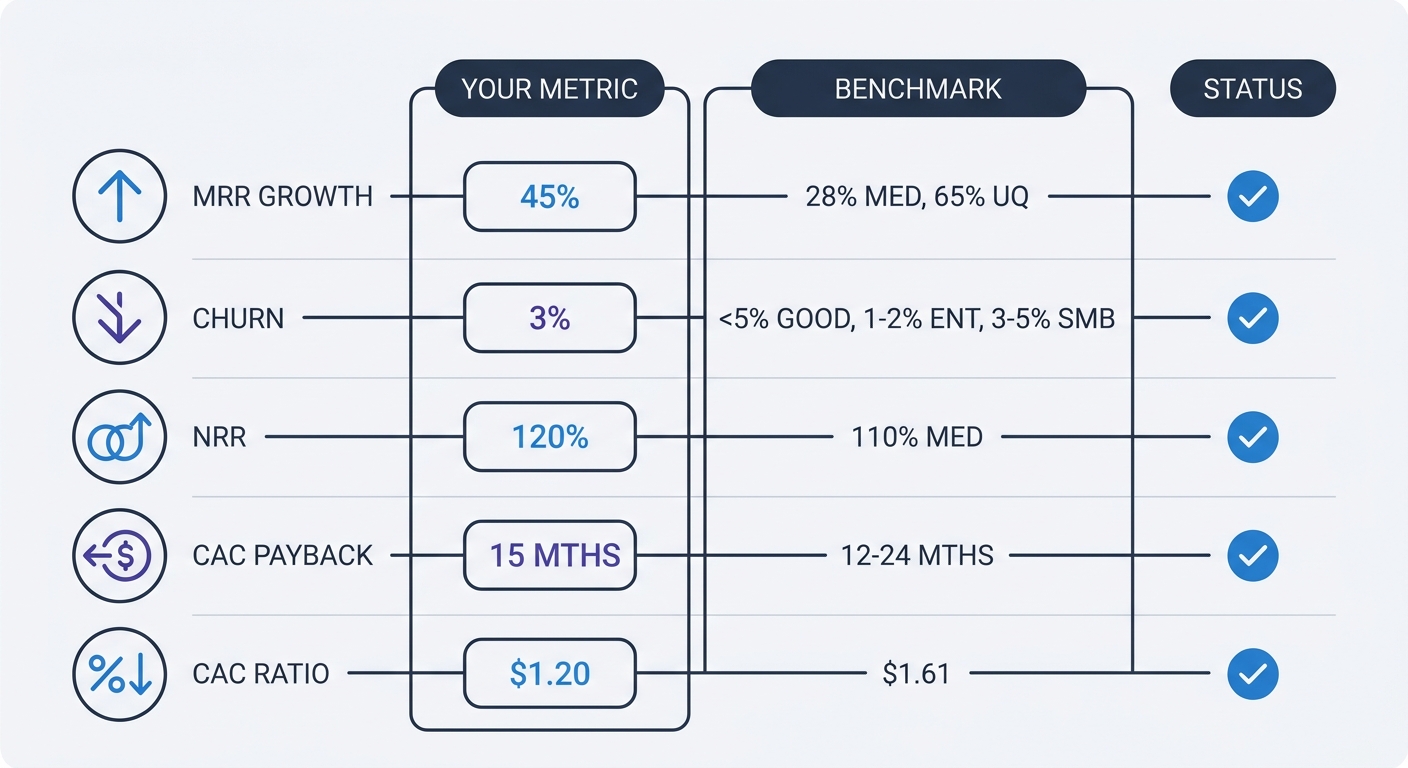
Median annual revenue growth hit 28% in 2025, down from 47% in 2024. Upper quartile companies grew at 65%, versus 88% the previous year. These benchmarks set investor expectations and help you gauge whether your growth trajectory supports the next funding round. Track revenue growth rate monthly, not absolute MRR alone.
Beyond Website Metrics: Product Analytics vs Web Analytics
Web analytics platforms measure traffic sources, landing page performance, and conversion rates from visitor to signup. Product analytics platforms measure what happens after signup: which features users adopt, how often they return, where they get stuck in onboarding, and which behavior patterns predict churn or expansion.
Install both. Use web analytics to answer "Which ad campaign drove the most trial signups?" Use product analytics to answer "What percentage of trial users who complete onboarding convert to paid?" The first question optimizes your acquisition spend. The second optimizes your product and onboarding flow.
Data and analytics tools serve 12,359 users on average, contributing to 11% of SaaS application usage. Your team uses analytics platforms—the question is whether you're using the right ones for your business model and stage.
The 5 Core Metrics Every SaaS Startup Must Track
Pre-seed companies do not need 47 KPIs. Focus on five metrics: MRR, churn rate, signups, activation rate, and burn rate. Add complexity as you scale, not before.
Revenue Metrics: MRR, ARR, and Growth Rate
Monthly Recurring Revenue (MRR) is the sum of all subscription revenue normalized to a monthly amount. A customer paying $1,200 annually contributes $100 to MRR. Calculate MRR by multiplying your number of customers by their average subscription price, adjusting annual contracts to monthly equivalents.
Track MRR growth rate month-over-month. A company growing from $10,000 to $12,000 MRR shows 20% growth. Repeat that for six months and you reach $29,859 MRR—nearly 3x the starting point. Compound monthly growth matters more than absolute revenue at the early stage.
Annual Recurring Revenue (ARR) is MRR multiplied by 12. Use ARR when discussing company valuation or comparing yourself to public SaaS benchmarks, which report annual figures. Use MRR for internal tracking and operational decisions because monthly data reveals trends faster.
Customer Economics: CAC, LTV, and Payback Period
Customer Acquisition Cost (CAC) divides your total sales and marketing spend by the number of new customers acquired in that period. Spend $10,000 on ads and sales salaries in March and close 20 customers, your CAC is $500. Include all acquisition costs: ad spend, sales team salaries, marketing tools, agency fees, and content production.
Customer Lifetime Value (LTV) estimates the total revenue a customer generates before churning. Multiply average revenue per account (ARPA) by average customer lifetime in months. If customers pay $100/month and stay for 24 months on average, LTV is $2,400. A healthy SaaS business maintains an LTV:CAC ratio above 3:1. Anything below 2:1 means you're spending too much to acquire customers relative to what they pay you.
CAC payback period measures how many months of subscription revenue it takes to recover the cost of acquiring a customer. Calculate it by dividing CAC by monthly revenue per customer. A 6-month payback period means you break even on acquisition costs after six monthly payments, then every subsequent payment contributes to profit. The median CAC payback period across B2B SaaS is 15 months, with SMB companies at 8-12 months, mid-market at 14-18 months, and enterprise at 18-24 months.
Blended CAC ratio reached $1.61 in 2023, showing a 22% jump from the previous year. Companies spent $1.61 in sales and marketing to generate $1 of new ARR. Rising CAC signals either more competitive markets or less efficient go-to-market strategies. Track this quarterly and investigate any upward trend.
Retention Metrics: Churn Rate and Net Revenue Retention
Churn rate measures the percentage of customers who cancel in a given period. Calculate monthly churn by dividing customers lost during the month by total customers at the start of the month. Lose 5 customers out of 100 at month-start, your monthly churn rate is 5%. To annualize this for comparison to industry benchmarks, use the compound formula: annual churn = 1 - (1 - monthly churn)^12. A 5% monthly churn rate compounds to approximately 46% annual churn, not 60%.
Annual churn below 5% is strong. Enterprise SaaS companies see 1-2% annual churn, while SMB-focused products see 3-5%. SMB churn can exceed 15-30% because small businesses fail or change needs more frequently than enterprises. If your churn rate exceeds these benchmarks, prioritize retention before scaling acquisition.
Net Revenue Retention (NRR) measures revenue retention including expansion, upgrades, and downgrades. Start with $100,000 in ARR from a cohort of customers. One year later, some churned, some downgraded, and some upgraded. If the remaining customers now generate $110,000 in ARR, your NRR is 110%. Median NRR hovers around 110%, meaning the average SaaS company grows revenue from existing customers by 10% even before adding new customers.
NRR above 100% means expansion revenue from upsells and cross-sells exceeds revenue lost to churn and downgrades. You grow without acquiring a single new customer. Track NRR by cohort (customers acquired in the same month) to see which acquisition channels or time periods produced the highest-value customers.
Privacy-First Analytics: The 2026 Compliance Environment
Why Google Analytics Is Risky for SaaS
Google Analytics 4 (GA4) transfers user data to U.S. servers, which reportedly violates GDPR under the Schrems II ruling. Austrian data protection authorities have reportedly fined a website operator €10,000 in 2026 for using GA4 with Standard Contractual Clauses, ruling that these safeguards don't protect EU citizens from U.S. surveillance laws. French and Italian regulators have allegedly issued similar guidance.
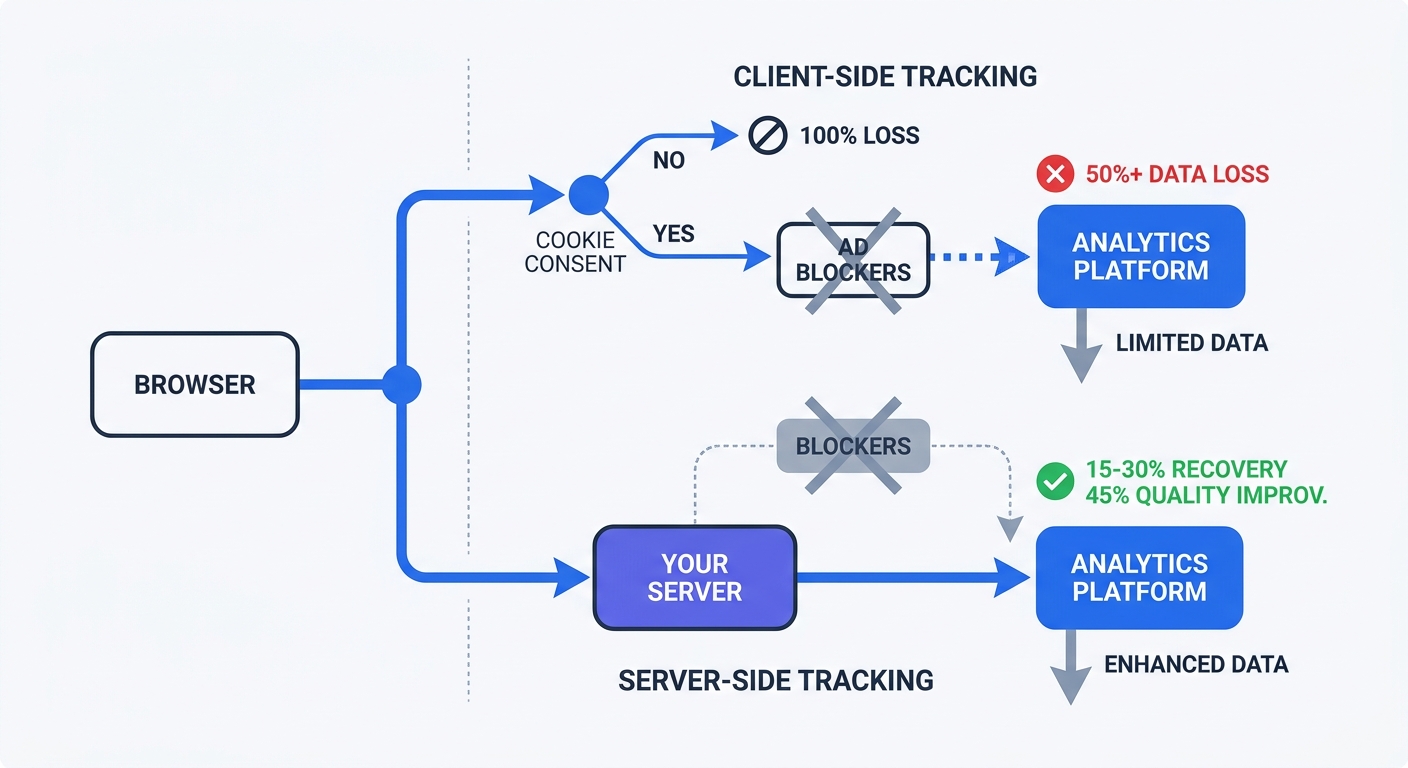
When users decline cookie consent—over 50% now do, up from 42% in 2024—you lose visibility into their behavior. GA4 requires cookie consent for most tracking features. Half your traffic becomes invisible in reports. This creates a data quality problem that compounds every business decision based on incomplete information.
Server-side tracking offers a partial solution by moving data collection from the user's browser to your server, then relaying processed data to analytics platforms. This architecture bypasses browser restrictions and ad blockers, improving data accuracy by 12.6%. Square improved conversion tracking by 46% after implementing server-side tags.
GDPR Fines and Enforcement Trends
GDPR fines exceeded €7.1 billion cumulatively by early 2026. The 2025 calendar year alone accounted for €1.2 billion—matching the previous year's total. Individual penalties can reach €20 million or 4% of global annual revenue, whichever is higher. These aren't theoretical risks. Enforcement increased every year since GDPR took effect in 2018.
Data protection authorities target analytics implementations. The Austrian GA4 fine represents a pattern: regulators scrutinize how companies collect, store, and transfer user data through analytics platforms. If your analytics setup transfers personal data to countries without adequate data protection laws, you're exposed to enforcement action.
Obtain freely given, specific, informed, and unambiguous consent for analytics tracking. Implement a double opt-in when handling sensitive or cross-border data. Allow users to withdraw consent. These requirements apply to any analytics platform that collects personal data, not Google Analytics alone.
Cookieless Tracking: What Works
Privacy-first analytics platforms collect aggregate behavioral patterns—page views, scroll depth, click patterns—without linking data to individual identities. Plausible Analytics operates consent-free by default because it doesn't collect personal data as defined by GDPR. The entire script weighs under 1KB, loads faster than GA4, and isn't blocked by ad blockers at the same rate.
Server-side tracking adoption has reached 67% among B2B companies, with data quality improving by an average of 41% after migration. This is the most impactful technical investment a marketer can make in 2026.
Traditional client-side tagging has three failure modes: ad blockers suppress the tags, browser privacy settings prevent cookie setting, and Intelligent Tracking Prevention (ITP) or Enhanced Tracking Protection (ETP) expire first-party cookies in as little as 24 hours. Server-side tracking eliminates all three by processing data on your infrastructure before sending it to analytics platforms.
Research from DoubleVerify and IAS published in 2025 shows contextual ads performing within 5-8% of behavioral targeting on click-through rates and within 10-12% on conversion quality. Cookieless advertising works. The performance gap between privacy-compliant and invasive tracking continues to narrow.
Choosing the Right Analytics Stack for Your Stage
Early Stage (Pre-Seed to Seed): Start Simple
Use existing tools with free plans. Mixpanel and Amplitude both offer free tiers suitable for early-stage startups. These platforms handle product analytics—tracking user behavior inside your application—without requiring you to build custom infrastructure.
Pair product analytics with a web analytics tool for marketing attribution. Swetrix provides privacy-first web analytics with EU hosting, no cookies, and GDPR compliance by default. Install it on your marketing site to track which channels drive signups, then use Mixpanel or Amplitude to track what those users do after signing up.
Start with five metrics: MRR, churn rate, signups, activation rate, and burn rate. Build dashboards that display these numbers and nothing else. Resist the temptation to track everything. More metrics create more noise and slower decision-making at this stage.
Growth Stage (Series A+): Build Your Data Infrastructure
At 1,000-10,000 users, your analytics needs change. Marketing attribution becomes more complex with multiple channels and campaigns running at once. Product analytics needs to segment users by dozens of attributes to identify which cohorts convert and retain best.
Implement a modern data stack: a customer data platform like Segment or RudderStack to collect events from all sources, a data warehouse like BigQuery or Snowflake to store raw data, dbt to transform raw data into clean tables, and Looker or Metabase to visualize results. This architecture creates a single source of truth for all company metrics.
Add specialized tools for specific use cases. ChartMogul pulls subscription data from Stripe, Recurly, and other billing systems to calculate accurate MRR, churn rates, and LTV forecasts. It produces investor-ready metric dashboards without manual spreadsheet work. Baremetrics focuses on churn analysis with clear breakdowns of voluntary and involuntary churn.
Privacy-Compliant Tool Comparison
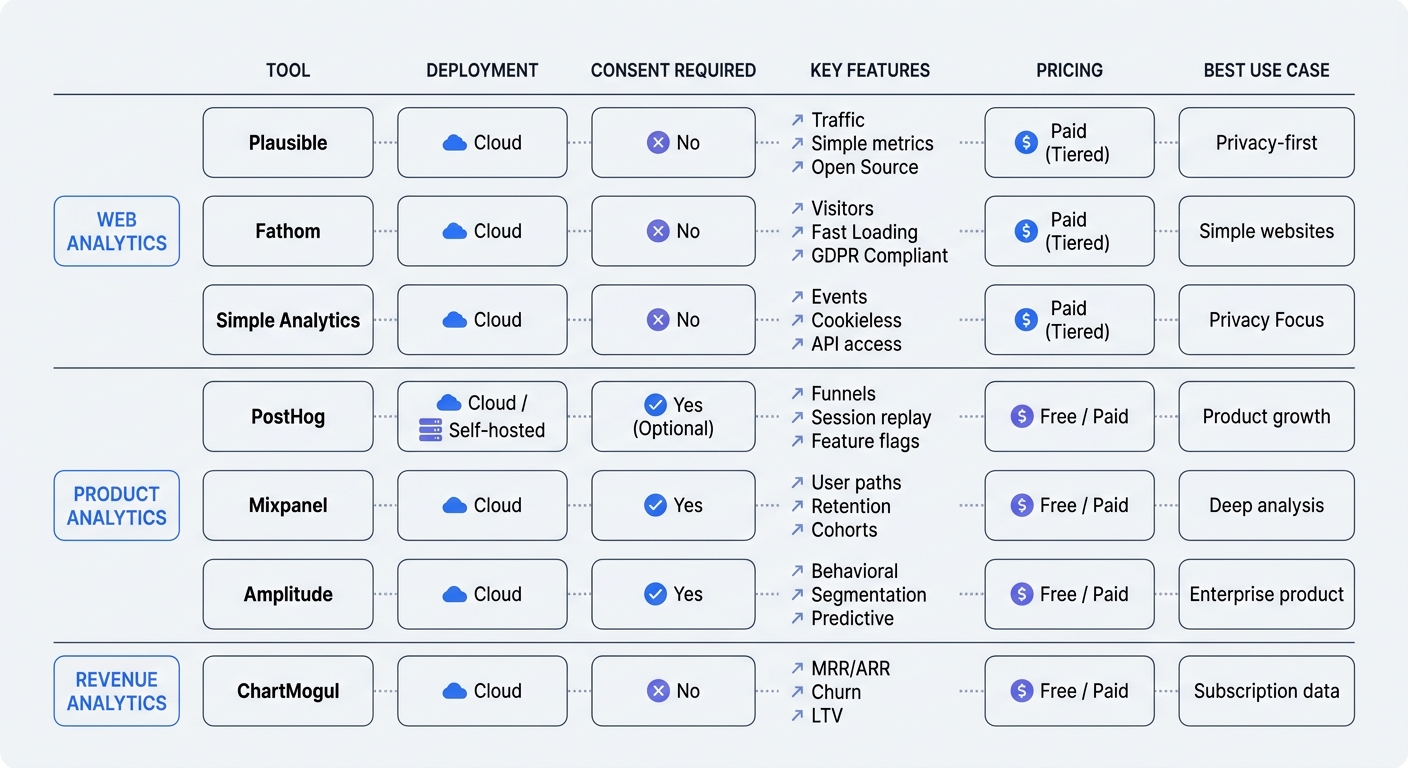
Web Analytics (cookieless, GDPR-compliant):
- Swetrix: EU-hosted, open-source, no cookies, real-time dashboards, performance monitoring, error tracking. Starts at 100,000 events/month for $19/mo.
- Plausible: Open-source, under 1KB script, no personal data collection, no consent banner required. Starts at $9/mo for 10,000 monthly pageviews.
- Fathom: Cookieless, EU hosting, simple interface. Starts at $14/mo for 100,000 pageviews.
- Simple Analytics: EU-based, no cookies, privacy-first by design. Starts at €19/mo for 100,000 pageviews.
Product Analytics:
- PostHog: Open-source, self-hosted or cloud, auto-capture events, session replay, feature flags. 1M events/month free on cloud plan.
- Mixpanel: User behavior tracking, funnel analysis, cohort reports. Free up to 100,000 tracked users.
- Amplitude: Product analytics, user journey mapping, predictive analytics. Free up to 10M events/month with data retention limits.
- Heap: Auto-capture all interactions, retroactive event definition, cookieless mode with identity stitching. Custom pricing.
Revenue Analytics:
- ChartMogul: Subscription analytics, MRR tracking, cohort analysis, integrates with Stripe/Recurly. Starts at $100/mo.
- Baremetrics: Churn analysis, revenue forecasting, Stripe integration. Starts at $108/mo.
Implementation Best Practices That Work
Start With Business Questions, Not Data Collection
Define clear objectives first. Write down three to five specific questions your analytics setup must answer:
- What's our user activation rate?
- Which acquisition channels drive the highest LTV customers?
- At what point in the trial do most users churn?
- Which features correlate with conversion to paid?
- How much runway do we have at current burn rate?
Let these questions drive your tracking plan and tool selection. If a metric doesn't help answer one of your core questions, don't track it yet. Data collection has a cost: engineering time to implement, storage costs, and cognitive load reviewing dashboards full of irrelevant numbers.
Create a tracking plan spreadsheet before writing any code. List every event you need to track, what properties each event should include, and which business question it answers. Share this document with your engineering team and update it before implementing new tracking.
Server-Side Tracking Implementation
Server-side tracking moves data collection from the user's browser to your server infrastructure. When a user completes a purchase, your backend sends the conversion event to your analytics platform instead of relying on JavaScript in the browser.
This architecture bypasses ad blockers, browser privacy settings, and cookie restrictions. 67% of B2B companies now use server-side tracking because it improves data quality by 41% on average compared to client-side-only approaches.
Implement server-side tracking for conversion events first: trial signups, subscription purchases, upgrades, and cancellations. These events impact revenue, so accurate tracking matters most. Keep client-side tracking for page views and engagement metrics where perfect accuracy matters less.
Most analytics platforms provide server-side SDKs for common languages. Segment and RudderStack offer unified APIs that send events to multiple destinations from a single server-side integration. This reduces engineering work when you want to add a new analytics tool.
Avoiding the 'Track Everything' Trap
Capturing too many metrics without clear goals creates noise. Teams get overwhelmed by vanity metrics like total pageviews or downloads that don't tie back to business outcomes. Every metric you track requires someone to monitor it, investigate changes, and decide whether to act.
Limit your primary dashboard to 5-10 metrics maximum. These should measure progress toward your current company goals. Create separate dashboards for specific use cases—one for marketing attribution, one for product engagement, one for customer success—but don't try to monitor everything at once.
Review your metrics quarterly and remove anything that hasn't influenced a decision in the past 90 days. If nobody looks at a metric or changes behavior based on it, stop tracking it. This discipline keeps your analytics setup focused and actionable.
Establish consistent definitions across tools. "Active user" might mean different things in your product analytics platform versus your billing system. Document how you define each metric and ensure all tools calculate it the same way. Without a single source of truth, reporting becomes unreliable and teams waste time reconciling conflicting numbers.
Advanced Techniques for SaaS Growth
Cohort Analysis for Retention Insights
Cohort analysis tracks customer groups based on their sign-up date, providing insights into how different segments behave over time. This helps assess customer lifetime value, retention trends, and onboarding effectiveness.
Create monthly cohorts: all customers who signed up in January 2026 form one cohort, February signups form another, and so on. Track each cohort's retention rate month by month. After six months, you can compare how January signups retained versus February signups at the same point in their lifecycle.
This reveals whether your product improvements work. If March cohorts retain better than February cohorts, something you changed between those months improved retention. If retention declines across successive cohorts, your product or market fit is weakening despite growing MRR.
Cohort analysis helps prioritize product roadmap decisions. Startups focus on meeting the needs of high-ticket user cohorts—the customers who pay the most and stay the longest. Identify which cohorts have the highest LTV, then analyze what those users have in common. Build features that serve more customers like them.
Funnel Optimization and Drop-Off Analysis
Funnel visualization shows the number of users reaching each step toward a goal and how many drop off at each stage. This information helps prioritize conversion optimization efforts.
Map your funnels: trial signup to first login, first login to activation event, activation to paid conversion, free plan to paid upgrade. Measure conversion rates at each step. If 1,000 users start trials but only 200 reach your activation event, you have a 20% activation rate and an 80% drop-off before users experience core value.
Focus optimization efforts on the step with the largest drop-off. Improving a step where 80% of users drop off has more impact than optimizing a step where 95% continue. Run experiments on the worst-performing step first: change onboarding copy, simplify the UI, add tooltips, send reminder emails.
Track funnel performance by acquisition source. Users from paid ads might convert at different rates than users from organic search or referrals. If paid traffic converts poorly, either your targeting is wrong or your landing page sets incorrect expectations. If organic traffic converts well, double down on SEO and content marketing.
Predictive Analytics for Churn Prevention
Analyze historical data to forecast user behavior. This means offering solutions before users churn—suggesting relevant features, addressing potential issues, or creating targeted in-app messaging.
Build a churn risk score based on usage patterns. Users who log in less than twice per week, never invite team members, and don't use your core feature are high churn risks. Calculate this score for every user and flag accounts that cross your threshold.
Trigger interventions for high-risk accounts: send a personal email from your founder, offer a free onboarding call, provide case studies showing how similar companies use your product, or unlock premium features to demonstrate value. These interventions cost less than acquiring a replacement customer.
AI-enabled analytics adoption is growing 30% year-over-year. The AI software market is projected to reach $80.6 billion by 2031. Predictive models will become more accessible to startups through no-code tools and pre-built integrations. Start with rule-based scoring now, then add machine learning models as your data volume grows.
Track the accuracy of your predictions. What percentage of users you flagged as high churn risk churned? If your model has low accuracy, refine the signals you're using or collect additional data points. A model that flags 80% of users as high risk isn't useful—you can't intervene with everyone.
Swetrix provides privacy-first analytics built for SaaS companies that care about GDPR compliance and data quality. Track user behavior without cookies, host your data in the EU, and get real-time insights into the metrics that matter. Start your 14-day free trial and see accurate analytics without compromising user privacy.