- Date
A Guide to Open Source Analytics Software
 Andrii Romasiun
Open source analytics software hands you the keys to the kingdom. You get direct access to the source code, which means full control over your data, the freedom to customize everything, and no more being trapped by a single vendor. It’s a completely different world from proprietary tools that often feel like a locked black box. With open source, you get a transparent, flexible toolkit to truly understand your users.
What Exactly Is Open Source Analytics Software?

Think of it this way. A proprietary analytics tool is like buying a pre-packaged cake mix. It’s convenient, sure, but you have no idea what’s really in it, you can’t change the flavor, and the recipe is a closely guarded secret. You’re stuck with what the box gives you.
Open source analytics, on the other hand, is like being given a professional chef's recipe book. You see every single ingredient and every step of the process. Want to swap sugar for honey or add a dash of cinnamon? Go for it. You have complete control because nothing is hidden.
That’s the core idea. The software’s source code is publicly available for anyone to look at, tweak, or improve. This community-driven approach creates a ton of trust and innovation, letting businesses build an analytics setup that is a perfect fit for their unique needs.
The Core Functions
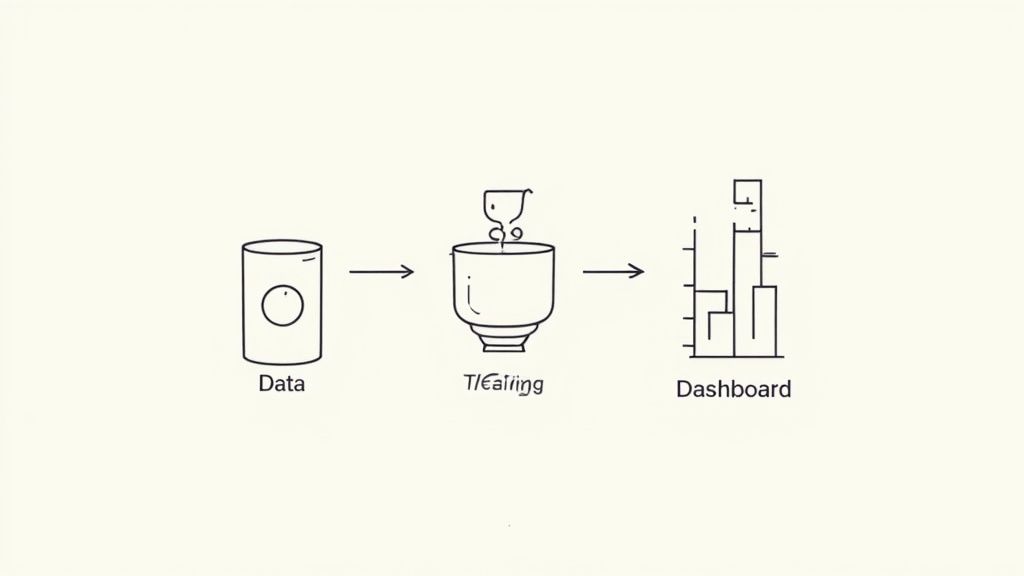
At the end of the day, any analytics tool—whether open source or proprietary—is built to do three main things. Its job is to help you make sense of user behavior and website performance.
- Data Collection: This is the first step, where the tool gathers information about every user interaction, like page views, button clicks, and other events you define.
- Data Processing: Next, it takes all that raw, messy data and cleans it up, organizing it into a structured format that you can actually work with.
- Data Visualization: Finally, it presents the processed data in a way humans can understand—think dashboards, charts, and reports that reveal clear, actionable insights.
The big difference with open source is that you have a window into each of these stages. You own your data, period. You decide where it's stored and how it's handled, which is a massive plus for any privacy-focused business. For a deeper look, you can explore our guide on the fundamentals of open source web analytics.
To better understand the trade-offs, here’s a quick comparison of the two models.
Open Source vs Proprietary Analytics at a Glance
| Attribute | Open Source Analytics Software | Proprietary Analytics Software |
|---|---|---|
| Cost Model | No licensing fees; costs are for hosting and maintenance. | Subscription-based (monthly/annual fees), often tiered by usage. |
| Data Ownership | You own and control 100% of your data. | Vendor often controls data storage and access. |
| Customization | Highly customizable; you can modify the source code. | Limited to features and options provided by the vendor. |
| Transparency | Fully transparent source code; you know exactly how it works. | "Black box" model; internal workings are secret. |
| Vendor Lock-in | None. You can switch providers or self-host at any time. | High. Migrating data and processes is often difficult. |
| Community & Support | Community-driven support (forums, docs) and paid professional services. | Dedicated customer support teams (often tiered by plan). |
Ultimately, the choice comes down to how much control and flexibility your organization needs.
Why It's Gaining Momentum
The move toward open source isn't just a small trend—it’s a major shift powered by real market demand. The global open source services market, which analytics is a part of, reached $35.3 billion in 2024 and is expected to climb past $132.7 billion by 2033.
This explosive growth is happening because businesses are tired of rigid, expensive solutions. They want flexibility, scalability, and control over their own data. You can read more about the forces driving this expansion in a recent market analysis from IMARC Group.
The core value proposition is simple: Instead of renting a restrictive tool, you are empowered to build and own an analytics asset that evolves with your business, free from sudden price hikes or feature limitations imposed by a third-party vendor.
The Real-World Advantages of Open Source Analytics

Picking an analytics platform isn't a small decision. It's a real commitment. You're not just choosing a piece of software; you're weaving it into the fabric of your business, investing serious time and resources into making it work. This is why the benefits of open source analytics software are so compelling—they go way beyond saving a few bucks on licenses and fundamentally shift how you interact with your own data.
This isn't just a niche trend, either. The open source model has become a cornerstone of modern tech stacks. The global market for open source software is valued at around $40 billion, with a huge chunk of that—34% of the open source intelligence sector—coming from data analytics. You can dig into the numbers in this detailed report from Mordor Intelligence.
So, let's break down the tangible benefits that are driving so many teams to make the switch.
Freedom From Vendor Lock-In
We’ve all heard the horror stories. Your entire business runs on a proprietary analytics tool, and then you get the email: the vendor is jacking up prices by 50% next month. Or maybe they’re sunsetting a feature your marketing reports absolutely depend on. Suddenly, you're stuck between a rock and a hard place: either cough up the money or start a massive, expensive, and painful migration project. That’s vendor lock-in.
Open source analytics offers you a way out of that trap. You're no longer handcuffed to a single company's roadmap, pricing whims, or ecosystem. You're in the driver's seat.
- Predictable Costs: You can host the software yourself and control every penny of the infrastructure cost. Or, you can pick a managed provider with transparent pricing, protecting you from surprise bills.
- Future-Proof Your Stack: If your hosting provider’s service starts to slip or your needs outgrow their offering, you can simply move your entire setup somewhere else—or bring it in-house—without losing a single byte of data.
This freedom gives you long-term stability. Your analytics foundation is yours to control, regardless of what some vendor decides in a boardroom halfway across the world.
Unmatched Customization and Control
Let's be honest, proprietary tools are built for the average user. They might get you 80% of the way there, but that last 20%—the part that’s unique to your business—is where the real insights live. With open source analytics software, you have the keys to the kingdom: the source code itself.
Think of it like buying a suit. Proprietary software is like a suit off the rack; it might fit reasonably well. Open source is like getting that suit custom-tailored; it’s built to fit you and you alone.
This level of control means you can tweak the software to perfectly match your workflows, build integrations with your weird internal tools, or even create brand-new features that nobody else has.
For instance, a startup could modify its analytics to track a super-specific engagement metric that no off-the-shelf tool even considers. An e-commerce business could build a direct pipeline from its supply chain software into its analytics dashboard, creating a single, unified view of the entire operation. That’s a powerful competitive advantage.
Enhanced Security Through Transparency
This might sound backward at first, but public code is often safer code. With proprietary, "black box" software, you're essentially taking the vendor's word for it that their platform is secure. You can't look under the hood to verify anything.
The open source world works differently. The code is out in the open, constantly being poked, prodded, and tested by a global community of developers and security experts.
- More Eyes on the Code: With thousands of people examining the software, vulnerabilities tend to get found and fixed incredibly fast—often much faster than in a closed, corporate environment.
- Full Transparency: You know exactly what’s happening with your data. There are no hidden backdoors, no secret data-sharing agreements. You can see precisely how information is handled, encrypted, and stored.
This transparent, community-driven approach creates a culture of accountability that results in incredibly robust and trustworthy platforms. And for any business that takes data privacy seriously, understanding the principles of privacy-friendly analytics is non-negotiable—open source provides the perfect foundation for building that trust.
Essential Features Every Analytics Tool Needs
So, you're sold on the idea of open source analytics software. That's the easy part. The real challenge is sifting through the options to find a tool that actually works for you. A powerful platform is more than just a collection of pretty charts—it’s the engine that turns messy, raw data into clear, confident decisions.
To pick the right one, you need to know what separates a basic visitor counter from a genuine analytics powerhouse. Let's walk through the non-negotiable features that ensure you can see the full story of what your users are doing, from start to finish.
Data Collection and Integration
First things first: your analytics tool is useless if it can't get to your data. The most fundamental feature is its ability to collect information from all the places your business lives and breathes. Think of it as building bridges to every data island in your company so nothing gets left behind.
This is all about breaking down data silos. A data silo is just an isolated pocket of information that keeps you from seeing the complete picture. For example, if your website analytics can't talk to your CRM, you’ll never know which marketing campaigns are actually bringing in your most valuable customers.
Look for tools that make this easy with:
- Simple tracking scripts for websites and mobile apps.
- Robust APIs that can pull data from other software, like payment gateways or help desks.
- Database connectors to tap directly into your company’s data warehouses.
Data Processing and Transformation
Let's be honest—raw data is a mess. It's often incomplete, full of junk, or formatted inconsistently. A great analytics tool has to do the dirty work of cleaning, organizing, and preparing this data before you ever see it. This is the crucial behind-the-scenes magic that makes your reports accurate and trustworthy.
Trying to analyze raw data is like trying to bake a cake with ingredients still in their packaging. It just won’t work. Data processing "unpacks" everything for you, filtering out bot traffic, standardizing event names, and enriching user profiles with helpful context.
Real-Time Data Visualization
Once your data is clean, you need to be able to make sense of it at a glance. That's where data visualization comes in. And I'm not talking about flashy, complicated charts; I'm talking about telling a clear, compelling story with your numbers.
The goal of any dashboard should be to answer important business questions in seconds, not minutes. Interactive charts, heatmaps, and customizable dashboards turn abstract numbers into tangible insights that anyone on your team can understand and act upon.
A good platform gives you the power to build dashboards that reflect your Key Performance Indicators (KPIs). You should have the flexibility to drag and drop widgets, apply filters on the fly, and share what you find with others effortlessly. This visual layer is what makes data accessible to everyone, not just the data scientists in the room.
Advanced Analytics Capabilities
Page views and user counts are a fine starting point, but the real "aha!" moments come from digging deeper. To truly understand why your users behave the way they do, you need features that let you get beneath the surface.
These are the capabilities that help you move from simply seeing what happened to understanding why it happened. They help you pinpoint exactly where users are dropping off in your sales funnel or identify the key actions that turn casual visitors into loyal customers.
Key advanced features to look for include:
- Segmentation: Grouping users by shared traits (like their location, device, or behavior) to see how different audiences interact with your product.
- Funnel Analysis: Mapping out the steps users take to complete a goal—like signing up or making a purchase—to see where they get stuck.
- User Journey Mapping: Following the complete path of an individual user to get a ground-level view of their experience.
Essential Analytics Features Checklist
Choosing an analytics tool can feel overwhelming, but breaking it down into core feature categories helps. The table below is a practical checklist you can use to evaluate different platforms and make sure you're getting the functionality that will actually drive your business forward.
| Feature Category | Must-Have Functionality | Business Impact |
|---|---|---|
| Data Collection | Easy-to-install tracking scripts, APIs, database connectors | Breaks down data silos for a complete view of the customer. |
| Data Processing | Bot filtering, event standardization, data enrichment | Ensures the data you're analyzing is accurate and reliable. |
| Data Visualization | Customizable dashboards, interactive charts, and heatmaps | Makes complex data easy for anyone on the team to understand. |
| Advanced Analysis | Segmentation, funnel analysis, and user journey mapping | Uncovers the "why" behind user behavior, not just the "what." |
| Automation | Custom alerts (email/Slack), scheduled reports | Frees up your team's time and ensures you never miss a critical insight. |
This checklist isn't exhaustive, but it covers the foundational pillars of any solid analytics solution. If a tool you're considering is weak in any of these areas, it's a major red flag.
Automated Alerting and Reporting
Finally, a top-tier analytics tool should work for you, not the other way around. Automated alerting and reporting features are your safety net, saving you from having to obsessively check dashboards all day.
You should be able to set up custom alerts that notify you via email, Slack, or Discord the moment a key metric spikes or plummets. Imagine getting an instant heads-up when website conversions suddenly drop—you could jump on a potential bug immediately. Scheduled reports can automatically send weekly performance summaries to your team, keeping everyone in the loop without adding another meeting to the calendar. It’s a proactive approach that ensures you never miss a critical change.
A Look at the Top Open Source Analytics Tools
Diving into open source analytics can feel a bit overwhelming at first. There are a ton of options out there, each with its own philosophy and strengths. Where do you even start?
To help cut through the noise, I've put together a list of some of the most respected and interesting tools in the space. This isn't about finding the one "best" tool for everyone. It's about understanding the landscape and seeing who does what best, so you can find the right fit for your project.
Matomo: The Comprehensive Web Analytics Suite
Matomo (which you might remember as Piwik) is one of the original players in this space. It's been around since 2007, and it shows. This is a mature, feature-packed platform that feels very much like a direct, privacy-first replacement for Google Analytics. If you're used to traditional web analytics, you'll feel right at home with its detailed reports on traffic sources, user demographics, and e-commerce goals.
Its biggest selling point is its sheer depth and the fact that you have 100% control over your data.
- Best for: Businesses, government agencies, and anyone in a regulated industry needing a full-featured analytics suite they can host themselves.
- Key Strength: An exhaustive feature set right out of the box, including detailed visitor logs, goal tracking, and highly customizable dashboards.
- Main Focus: Traditional web and marketing analytics.
Matomo is a serious powerhouse if you need granular data and are comfortable managing a more complex system. It's a go-to for teams looking for robust alternatives to Google Analytics that don't cut corners.
Plausible Analytics: The Lightweight and Simple Choice
On the complete opposite end of the spectrum, you have Plausible Analytics. This tool was built from the ground up with simplicity and performance in mind. It throws out the complexity of legacy platforms for a beautiful, single-page dashboard that gives you just the essential metrics. The tracking script is tiny, so it won’t slow your site down.
Plausible’s entire philosophy is about delivering actionable insights without the data overload.
- Best for: Bloggers, small businesses, and solo founders who want straightforward, privacy-friendly stats without a learning curve.
- Key Strength: Simplicity, a feather-light script, and a focus on privacy that often means you don't even need a cookie banner.
- Main Focus: Essential website traffic metrics.
If you just want to know what your top pages are, where your traffic is coming from, and how you're trending, Plausible is fantastic.
PostHog: The All-in-One Product Analytics Platform
PostHog is a different beast entirely. While it can track pageviews, its real mission is product analytics. It’s designed for product managers and engineers who need to understand how people actually use their app. This goes way beyond web traffic to track things like custom events, user funnels, feature adoption, and even session replays.
Think of it as the ultimate toolkit for mapping out the entire user journey inside your software.
- Best for: Startups and tech companies building complex applications who need to analyze in-product behavior to guide their roadmap.
- Key Strength: It bundles product analytics, session replay, A/B testing, and feature flags into one unified platform.
- Main Focus: Deep product and user behavior analysis.
When you need to answer questions like, "What percentage of users completed our onboarding?" or "Is anyone using that new feature we just shipped?", PostHog is the tool you reach for.
Swetrix: The All-Rounder for Performance and Insights
And then there's Swetrix, which strikes a balance by bringing essential web analytics and powerful performance monitoring under one roof. The dashboard is clean and intuitive, making it simple to track your traffic sources, user engagement, and other core metrics at a glance.
Here’s a quick look at the Swetrix dashboard, which keeps key metrics front and center.
The design philosophy is all about giving you actionable insights without the clutter.
But what really makes Swetrix stand out is its built-in real-user monitoring and error tracking. This lets you see not only what your users are doing but also the quality of their experience. You can monitor your site's real-world speed, pinpoint performance issues, and get alerts for frontend errors—all from the same place.
Swetrix bridges the gap between marketing analytics and developer tools, creating a single source of truth for both user behavior and technical performance.
This integrated approach is incredibly powerful. You can instantly see if a sudden drop in conversions corresponds to a spike in JavaScript errors or a slow-loading page.
- Best for: Founders, marketing teams, and developers who want a privacy-first platform that connects the dots between user behavior and site performance.
- Key Strength: A unified view of analytics, real-user performance monitoring, and error tracking in one intuitive package.
- Main Focus: All-in-one web analytics and performance insights.
A Practical Guide to Implementation and Management
Picking out a great piece of open source analytics software is just the first step. The real magic happens during implementation—that’s when you turn a promising tool into the engine that drives your company’s decisions. Without a clear plan, even the most powerful software will just sit there collecting digital dust.
This guide is your roadmap for getting your solution up and running the right way. We're moving beyond simple installation to true integration, making sure the data you gather is meaningful, trustworthy, and actually used by your team to grow the business.
Planning and Defining Your KPIs
Before you write a single line of code or click "install," you have to answer a crucial question: What are we actually trying to measure, and why? Jumping straight into the technical setup is like building a house without a blueprint. You might end up with something standing, but it almost certainly won't be what you need.
This first phase is all about defining your Key Performance Indicators (KPIs). These are the hard numbers that tell you whether you're getting closer to your business goals.
- For an e-commerce store, a vital KPI might be the cart abandonment rate.
- For a SaaS product, it could be the number of weekly active users.
- For a content blog, you’d likely focus on time on page for your most important articles.
Nailing down these KPIs from the start gives your entire analytics strategy a purpose. Every dashboard you build and every report you pull should be designed to give you insight into these core numbers. This focus keeps you from getting lost in a sea of vanity metrics that look nice but don't mean much.
Technical Setup and Deployment
Once you have a solid plan, it's time to get your hands dirty and get the software running. With open source analytics, you typically have two paths to choose from for deployment. Each has its own pros and cons when it comes to cost, control, and how much technical work is involved.
1. Self-Hosting: This is the full DIY approach. You download the software and install it on your own servers, whether they're in-house or in the cloud. This route gives you ultimate control and privacy, but it also puts you on the hook for all security, maintenance, and updates.
2. Managed Hosting: Think of this as the "done for you" option. A third-party company (often the software creators, like us at Swetrix) handles all the technical heavy lifting. You get a platform that's ready to go, without ever having to worry about server management, scaling, or security patches. It's usually the most practical choice for teams that want to focus on data, not infrastructure.
The infographic below offers a simple way to think about choosing a tool based on what you value most, which in turn can influence your deployment decision.
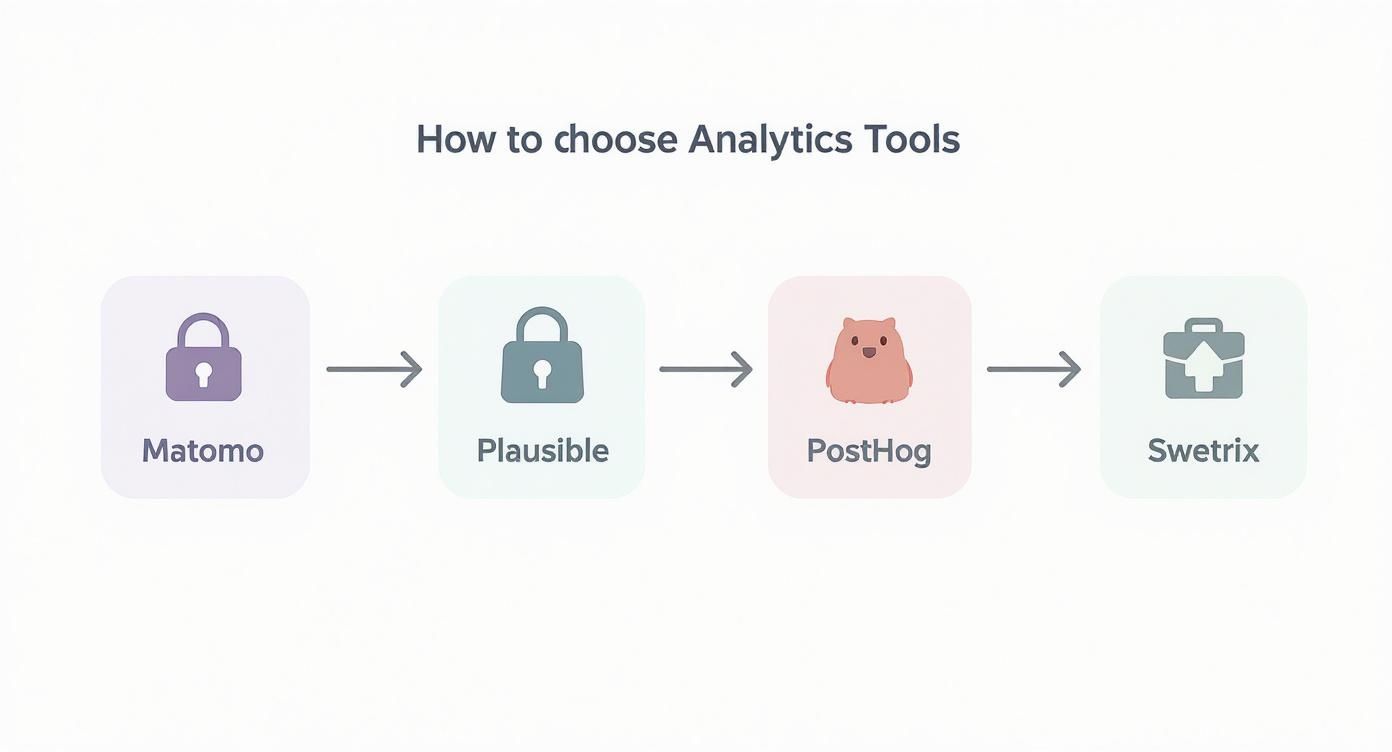
This visual shows how different tools are built for specific priorities, helping you align your implementation strategy with your main objectives.
Data Integration and Validation
With your platform live, the next critical task is making sure it's collecting clean, accurate data. This means installing tracking scripts on your website or app and then double-checking that events are firing correctly. The old saying "garbage in, garbage out" is the first rule of analytics for a reason.
Take your time here. Use your browser's developer tools or the platform's real-time dashboard to watch the data come in. Confirm that page views, button clicks, and form submissions are all being recorded exactly as you expect. This validation step is what builds trust in your data, and without trust, your team will never rely on it.
Driving Team Adoption
Finally, an analytics tool is only valuable if people actually use it. The last—and arguably most important—stage of implementation is all about encouraging your team to adopt it. This part is less about technology and more about people and culture.
Start by creating custom dashboards for different departments—a marketing view, a product view, one for the leadership team. Host a quick training session to walk everyone through the key reports and, most importantly, show them how to answer their own questions. The goal isn't just to have data; it's to make data accessible and empower every person on your team to make smarter decisions in their daily work.
Let's Tackle the Big Questions
Jumping into the world of open source analytics can feel like a big shift, and it’s natural to have questions. You're moving away from the familiar and into a space that promises more control, but might seem more complex. Let's clear the air and walk through the common concerns we hear from teams just like yours.
We'll get straight to the point on the big topics: cost, security, technical skills, and how these tools really stack up against the 800-pound gorilla in the room, Google Analytics.
Is Open Source Analytics _Really_ Free?
This is usually the first question people ask, and the answer isn't a simple yes or no. The software license is free, but running it has costs.
Think of it this way: someone gives you a professional-grade espresso machine for free. The machine itself didn't cost you a penny. But you still need to buy the coffee beans, pay for the water, and cover the electricity to actually make a cup of coffee.
The "free" part of open source means you don't pay licensing fees. You can download the code, install it, and even change it without ever paying the creators. The costs you do need to think about are the operational ones.
This is often called the Total Cost of Ownership (TCO), and it usually includes things like:
- Hosting: You need a server to run the software on, and that comes with a monthly bill.
- Maintenance: Someone has to be on top of updates, security patches, and backups. It doesn't happen on its own.
- Expertise: If you decide to host it yourself, you’ll likely need a developer or systems admin to manage all the technical bits and pieces.
A lot of open source projects, including Swetrix, solve this by offering a managed hosting plan. This approach bundles all those operational headaches into a straightforward subscription fee. You get all the benefits of open source without having to manage a server yourself.
How Does It Compare to Google Analytics?
This is a huge one. The difference isn't just about features—it's about philosophy. When you boil it down, the three biggest distinctions are data ownership, privacy, and how much you can tinker with the tool.
With an open source tool, you own your data. Full stop. It lives on your servers (or your managed provider's), and you have complete control over who can access it and what happens to it. This is a massive advantage for anyone trying to comply with privacy laws like GDPR and build real trust with their audience.
Google Analytics works differently. It’s an incredible tool, but your data is processed on Google's servers and becomes part of its massive advertising ecosystem.
Here’s a quick breakdown of the trade-offs:
| Aspect | Open Source Analytics Software | Google Analytics (Free Version) |
|---|---|---|
| Data Ownership | 100% yours. You're in control. | Data is processed by Google. |
| Privacy | Designed for GDPR compliance. | Data can be used for advertising. |
| Customization | Limitless. Change the source code. | Limited to what's offered. |
| Data Sampling | None. You see 100% of your data. | Often samples data on high-traffic sites. |
| Transparency | Full. You can read every line of code. | A "black box." The inner workings are hidden. |
Do I Need to Be a Developer to Use These Tools?
Not at all. This is probably the biggest myth holding people back. While you’d need a developer for the heavy lifting of self-hosting or making custom code changes, using a modern open source tool day-to-day is something anyone can do.
Platforms like Swetrix are designed with marketing, product, and business teams in mind. If you've ever used Google Analytics, you'll feel right at home in a well-designed open source alternative.
Here’s how they’ve become so accessible:
- Managed Cloud Versions: These services take care of all the technical setup. You just sign up, grab a small tracking script, and add it to your site. No coding required.
- Intuitive Dashboards: The best tools are all about clean, user-friendly interfaces, often with drag-and-drop report builders that make sense.
- Clear Documentation: Good projects come with extensive guides and active community support to help you get answers fast.
For anyone who chooses a managed service, the technical barrier has pretty much been eliminated.
What About the Security Risks?
This is another area where perception and reality can be miles apart. The biggest security risk with open source software isn't the code itself—it's neglect.
Because the source code is public, it's constantly being examined by a global community of developers and security experts. This "many eyes" effect often means bugs and vulnerabilities are found and fixed much faster than in a closed, proprietary system. It’s like having a worldwide security team working for you for free.
The real key to security is proactive management. If you're self-hosting, that responsibility is all on you. You have to apply security patches the moment they're released. If you wait, you’re leaving a door open for trouble. This is exactly why a trusted managed provider is often the safest bet—their entire job is to handle security and maintenance so you don't have to.
Ready to take control of your analytics with a tool that respects your data and your users' privacy? Swetrix offers a powerful, intuitive, and open source analytics platform that’s easy to get started with.