- Date
The Essential Guide to Get Website Insights for 2025
 Andrii Romasiun
Unlock a competitive edge in 2025 by learning to get insights that drive real results. In today's digital world, organizations face rapid change and growing data complexity. The ability to get insights quickly and accurately is more crucial than ever.
This guide walks you through proven steps to get insights that matter. You will discover the basics of insight generation, the newest tools, step-by-step data validation, ethical considerations, and upcoming trends.
Ready to turn your data into actionable strategies? Dive in and learn how to get insights that keep your organization agile, informed, and future-ready.
Understanding Insights: What They Are and Why They Matter in 2025
In 2025, the ability to get insights from data is a defining factor for organizational success. But what exactly are insights in the context of business intelligence and analytics? Simply put, insights are actionable conclusions drawn from analyzing data, transforming raw information into clear guidance for strategic decisions. Unlike surface-level observations, true insights provide depth, revealing patterns and opportunities that are not immediately obvious.
The world is moving rapidly from intuition-based decisions to a data-driven mindset. Leaders no longer rely solely on gut feelings; they now expect every major decision to be backed by robust evidence. The sheer scale of available data is staggering—over 90 percent of the world’s data has been created in just the last two years. This unprecedented volume means organizations must get insights that are both timely and relevant, or risk falling behind.
Why is this shift so critical in 2025? Data is becoming more complex, with sources ranging from behavioral analytics to transactional records and social media interactions. Organizations that can get insights from this complexity are better equipped to innovate, improve efficiency, and stay ahead of competitors. For example, analyzing member data can inform where to host events, which products to prioritize, or how to tailor marketing campaigns for maximum impact.
Consider the following practical examples of how organizations get insights to drive real-world results:
| Use Case | Data Source | Actionable Insight |
|---|---|---|
| Event Planning | Member Location Data | Choose optimal event venues |
| Marketing Strategy | Engagement Metrics | Refine messaging and channel selection |
| Product Development | User Feedback | Identify feature requests and pain points |
However, the value of insights is only as strong as the quality of the underlying data. Acting on incomplete or unvalidated information can lead to costly missteps, such as launching a campaign in the wrong market or investing in features that users do not want. Inaccurate insights undermine trust and waste valuable resources.
The process to get insights that truly matter requires rigorous validation and a collaborative approach. Cross-functional teams—combining expertise from IT, marketing, operations, and leadership—ensure that data is interpreted correctly and aligned with business goals. This collaboration reduces bias, increases accuracy, and leads to more innovative solutions.
For a deeper look at the fundamentals of insights in analytics, you can explore Insights and Web Analytics Explained, which provides an accessible overview of the key concepts and best practices.
Ultimately, organizations that prioritize structured, validated approaches to get insights are positioned to thrive in the increasingly complex digital landscape of 2025. By embracing data as a strategic asset, they unlock opportunities for growth, efficiency, and sustained competitive advantage.

Step 1: Laying the Foundation—Identifying and Organizing Your Data
Establishing a solid foundation is the first critical step if you want to get insights that will drive strategic decisions in 2025. Without a well-organized data structure, even the most advanced analysis tools will fall short. A robust data framework not only streamlines your workflow but also minimizes costly errors and enables more accurate, actionable outcomes.
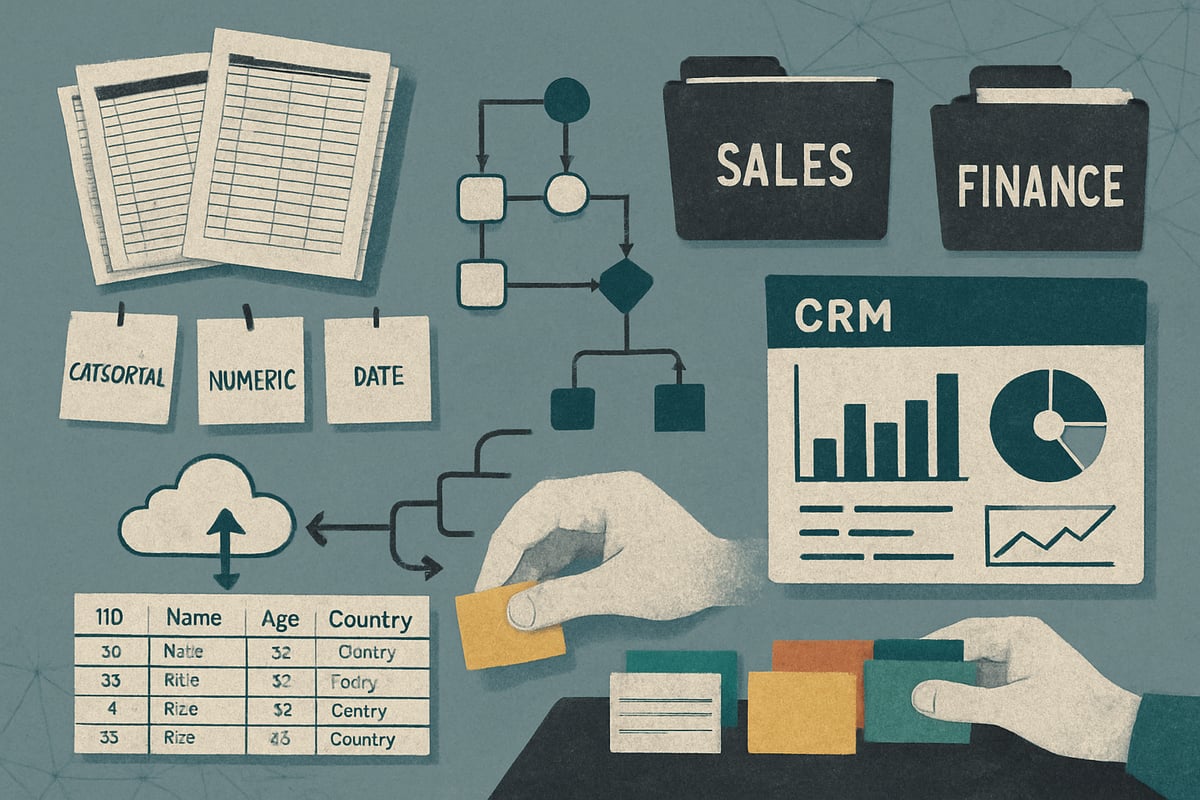
Start by taking inventory of all data sources within your organization. Common sources include CRM systems, marketing automation platforms, online communities, and customer support databases. Mapping these sources is essential for understanding the full picture and ensuring no valuable information is left behind.
Data comes in many forms—categorical, numeric, date, free-form, and boolean—so standardizing these types across platforms is key. For example, aligning member numbers across different platforms ensures consistency for unified analysis. This structured approach is the foundation upon which you can confidently get insights that inform business growth.
Best Practices for Data Categorization
To get insights that are both accurate and actionable, you need to categorize your data effectively. Start by developing a data dictionary—a centralized reference that defines each data field, its format, and its source. This ensures everyone in your organization speaks the same language when it comes to data.
Use templates to standardize data collection across teams and platforms. Tagging and labeling data at the point of entry makes future retrieval and analysis much smoother. For cross-platform compatibility, ensure that formats such as dates or categories are consistent, which prevents data mismatches during aggregation.
Consider the following best practices:
- Create data dictionaries to define each variable.
- Use templates for recurring data types and surveys.
- Implement tagging for easy filtering and reporting.
- Standardize formats (e.g., YYYY-MM-DD for dates).
- Convert free-form feedback into structured categories whenever possible.
For example, transforming open-ended survey responses into predefined categories enables you to get insights quickly and compare trends over time. This approach also simplifies integration with analytics tools and reduces the risk of human error.
Tools and Technologies for Data Organization
Leveraging the right tools is essential to efficiently get insights from your data. Modern data management platforms unify disparate sources and automate much of the organizational work. Look for platforms that offer seamless integration with your existing systems, whether they are cloud-based or on-premises.
Automation tools can handle repetitive tasks like data cleaning and deduplication, freeing up your team to focus on interpretation and strategy. Open-source solutions provide flexibility and customization, while cloud-based tools offer scalability and remote accessibility.
Here is a quick comparison of common solutions:
| Tool Type | Key Function | Example Features |
|---|---|---|
| Data Integration | Merge data from multiple sources | API connectors, ETL processes |
| Data Cleaning | Remove duplicates, fix errors | Automated validation, deduplication |
| Data Cataloging | Organize and index data | Tagging, search, data lineage |
For organizations eager to transform data into competitive advantage, using advanced tools is a must. To learn how to turn well-organized analytics into actionable results, explore this Analytics and Actionable Insight Guide.
Building a strong organizational foundation ensures you can get insights that are reliable, timely, and tailored to your business needs. With the right processes and technologies, your data becomes a powerful asset for strategic growth.
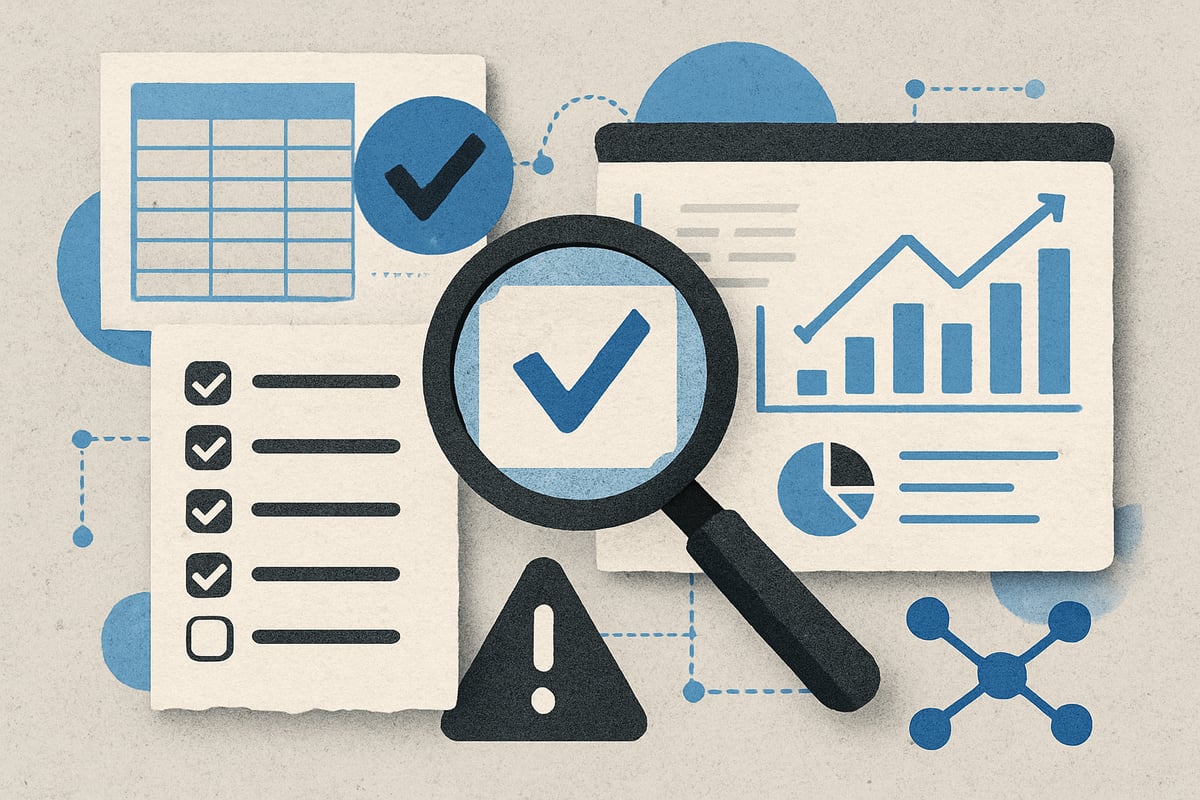
Step 2: Validating Data Quality—Ensuring Trustworthy Insights
Validating data quality is the backbone for organizations aiming to get insights that inform smart decisions. Without trustworthy data, any insight can be misleading, leading to costly mistakes. As data volumes soar in 2025, robust validation is not just a best practice, it's a necessity for reliable analytics.
A structured approach to data validation ensures that your efforts to get insights are built on a solid foundation. Let’s break down the essential steps and tools you need to make your data trustworthy and actionable.
Data Validation Frameworks and Checklists
To get insights that drive results, start with a clear validation framework. A systematic process helps you review, document, and improve your data sources before analysis begins.
Key criteria for data quality include:
| Criterion | Description |
|---|---|
| Completeness | Are all necessary data points present? |
| Timeliness | Is the data up to date and relevant? |
| Validity | Does the data conform to defined formats? |
| Consistency | Is data uniform across sources and time periods? |
| Integrity | Has the data remained accurate and unaltered? |
Creating a checklist for each data project can streamline validation. For example:
- Review data for missing fields.
- Cross-check timestamps and update cycles.
- Confirm values match expected formats.
- Compare datasets for consistency.
Using templates ensures repeatability and speeds up future projects. For more on leveraging validated user data, see User Insights for Smarter Decisions.
Addressing Common Data Quality Issues
Common obstacles can prevent you from being able to get insights you can trust. Missing values, outdated records, and inconsistent formats are frequent challenges.
To address these:
- Identify missing or incomplete data using automated tools.
- Standardize formats across platforms, such as dates or categories.
- Verify accuracy by cross-referencing with trusted sources.
Human error and bias can also creep in. Regular audits and automated validation scripts help minimize these risks. Training team members on data entry standards is equally important.
Deduplication tools can remove redundant entries, while real-time monitoring flags anomalies quickly. By tackling these issues early, you ensure that your efforts to get insights are not wasted on flawed or misleading information.
Real-World Example: Data Validation in Action
Imagine planning an annual event and needing to get insights on member locations. If location data is incomplete or outdated, your analysis could misguide venue selection.
Begin by auditing your member database for gaps. Use cross-referencing to update missing addresses. Standardize city and state fields for uniformity. Run automated scripts to flag suspicious entries, like duplicate names or invalid zip codes.
After validation, your team can confidently analyze location trends and choose event sites that maximize attendance. This approach demonstrates how thorough data validation leads to actionable, trusted insights and helps organizations get insights that drive measurable results.
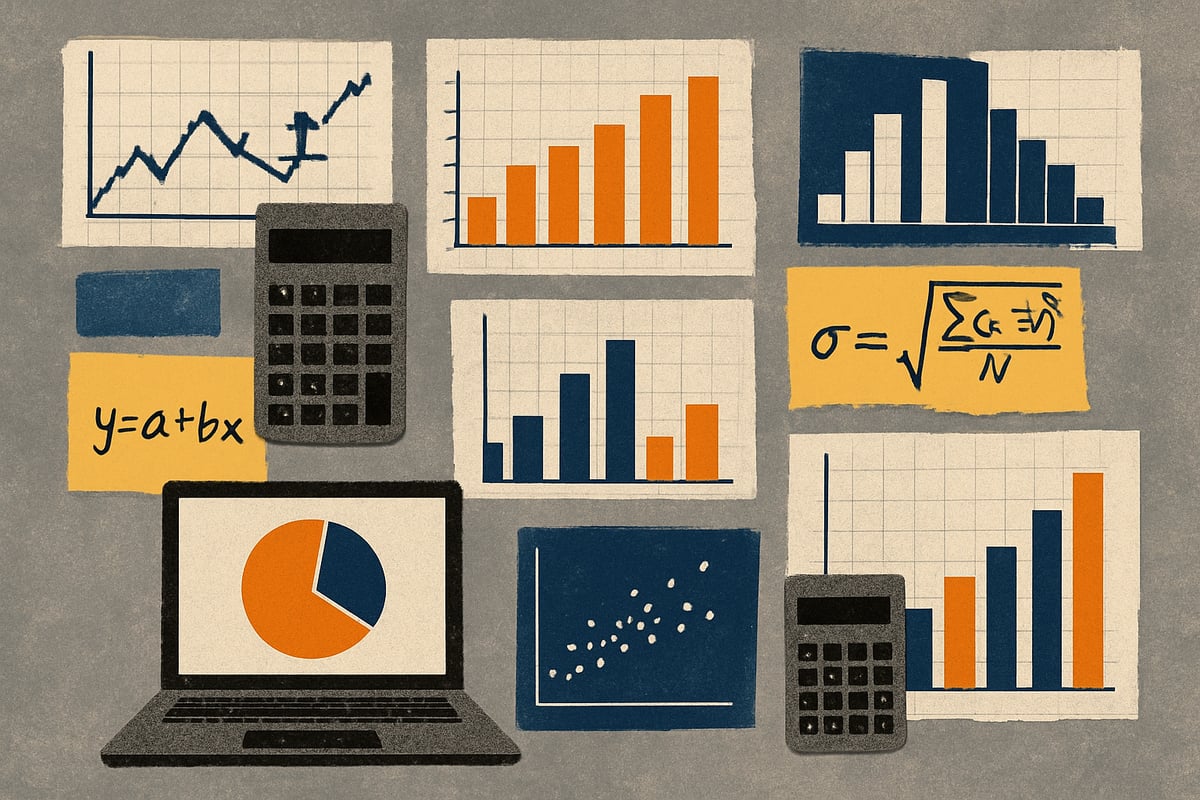
Step 3: Turning Data into Insights—Analysis and Aggregation Methods
Unlocking the full value of your data means more than collecting numbers. To truly get insights that drive your organization forward, you need robust analysis and aggregation methods. In this section, we explore how to transform raw information into actionable intelligence using proven statistical techniques and visualization tools.
Central Tendency: Mean, Median, and Mode
Central tendency measures are the cornerstone of data analysis. They help you get insights into the "typical" value in your dataset. The three most common measures are mean (average), median (middle value), and mode (most frequent value).
- Mean: Add all values, then divide by the number of entries. Great for normally distributed data.
- Median: The middle value when data is sorted. Useful when your data contains outliers.
- Mode: The most frequently occurring value. Best for categorical data.
For example, if you're analyzing member engagement, the mean tells you the average number of events attended per member, while the median can reveal if most members are more or less engaged than the average. The mode helps identify the most common level of participation.
| Measure | When to Use | Example Use Case |
|---|---|---|
| Mean | Symmetrical data | Average event attendance |
| Median | Skewed data, outliers | Typical engagement |
| Mode | Categorical data | Most-used feature |
Choosing the right measure ensures you get insights that are both accurate and meaningful. Always consider the nature of your data before selecting a method.
Frequency Distribution and Data Visualization
Frequency distribution shows how often each value appears in your dataset. This is essential to get insights about patterns and trends that might not be obvious when looking at raw numbers.
Histograms are a powerful way to visualize frequency distributions. By grouping data into intervals, you can quickly spot peaks, gaps, and clusters. For example, visualizing member activity by region or time period can highlight where your engagement strategies are most effective.
- Steps to create a histogram:
- Divide data into intervals (bins).
- Count how many values fall into each bin.
- Plot the counts on a bar chart.
Visual tools like pie charts and bar graphs also help you get insights at a glance, making it easier to communicate findings to stakeholders. When data is visualized, patterns and anomalies become much clearer, supporting smarter decision-making.
Measuring Spread: Range and Outliers
Understanding the spread of your data is crucial to get insights into variability and detect unusual patterns. Key metrics include range, interquartile range (IQR), and identification of outliers.
- Range: Subtract the smallest value from the largest. This gives a quick sense of the overall spread.
- Interquartile Range (IQR): The difference between the 75th and 25th percentiles. This focuses on the "middle" of your data, minimizing the impact of outliers.
- Outliers: Data points that fall far outside the typical range. These can signal errors, unique opportunities, or emerging risks.
Box-and-whisker plots are especially effective for visualizing spread and spotting outliers. For example, if your website traffic shows occasional spikes, a box plot can help you get insights into whether these are true growth signals or just anomalies.
When you measure spread, you’re equipped to manage risk and respond to unexpected changes with confidence.
From Insight to Action: Applying Analytical Results
Analysis is only valuable when it leads to action. Once you get insights from your aggregated data, the next step is turning those findings into strategic decisions.
Start by translating statistical results into clear recommendations. For instance, if your analysis shows that engagement is highest in a particular region, you might allocate more resources there. Visualization tools help you present results to stakeholders, ensuring your message is clear and persuasive.
Effective communication of insights supports cross-functional collaboration and faster decision-making. Consider using dashboards and regular reports to keep teams aligned.
For more on how organizations are using analytics to inform smarter decisions in 2025, check out Data Analytics Insights for Smarter Decisions.
By consistently applying these analysis and aggregation methods, you ensure that you not only get insights but also turn them into real-world results. The journey from data to decision is continuous, and these steps keep your organization agile and informed.
Ethical, Legal, and Privacy Considerations in 2025 Insights
As organizations strive to get insights from their data in 2025, the ethical, legal, and privacy landscape is more complex than ever. With regulations like GDPR and CCPA continually evolving, businesses must ensure compliance while maintaining user trust.
Ethical data collection and transparency are no longer optional. They are fundamental to any data-driven strategy. The rise of privacy concerns, especially regarding cookies and tracking, means organizations must rethink how they get insights without compromising user rights.
Trust and compliance are the backbone of sustainable insight strategies. Acting without regard for privacy can lead to severe reputational damage, legal consequences, and loss of stakeholder confidence. To get insights responsibly, every step of the data journey must be scrutinized for ethical and legal adherence.
Building a Privacy-First Insight Strategy
To get insights while respecting privacy, organizations must embed compliance and ethics into every phase of their analytics process. Begin by clearly communicating data collection purposes and obtaining explicit user consent. This transparency builds trust and strengthens your brand reputation.
Adopting privacy-focused analytics tools is key. Cookie-less solutions, like Swetrix, enable companies to get insights without invasive tracking, ensuring compliance with global regulations. By leveraging Privacy-Friendly Analytics Insights, you can explore how these platforms offer actionable data while prioritizing user privacy.
A privacy-first approach also means prioritizing data ownership. Ensure your organization retains control over collected data and avoids third-party misuse. Regular audits and clear documentation of consent further strengthen your compliance posture.
Practical steps to implement a privacy-first strategy include:
- Mapping all data collection points
- Updating privacy policies for clarity and accessibility
- Training staff on data protection best practices
By making privacy a core value, you not only avoid legal pitfalls but also empower your team to get insights that are truly responsible and future-proof.
Navigating Global Data Regulations
The global regulatory environment for data is rapidly shifting, and organizations looking to get insights must stay ahead of these changes. Laws like GDPR in Europe and CCPA in California set high standards for user rights, data access, and transparency.
Key differences between regions include consent requirements, data breach notification timelines, and the scope of user rights. For instance, GDPR mandates explicit consent and the right to be forgotten, while CCPA emphasizes consumer access and opt-out options.
To get insights across multiple jurisdictions, develop a robust compliance framework:
- Centralize your data governance policies
- Standardize consent procedures for all markets
- Monitor legislative updates and adjust practices promptly
A comparison table can help clarify regional requirements:
| Regulation | Consent | User Rights | Breach Notification |
|---|---|---|---|
| GDPR | Explicit | Access, Erasure, Portability | 72 hours |
| CCPA | Implied/Opt-out | Access, Deletion, Opt-out of Sale | Within reasonable time |
Organizations must also prepare for upcoming changes in 2025, such as new cross-border data transfer rules and stricter enforcement on data minimization. Regular training and cross-functional collaboration ensure your teams can get insights without risking compliance failures.
Staying informed and proactive allows you to get insights that drive value while honoring every user's privacy, regardless of where they live.
Future Trends: Evolving Tools and Techniques for Insights in 2025
Adapting to rapid technological change is essential for organizations aiming to get insights that drive real results in 2025. New tools and methods are emerging, and businesses must stay ahead to remain relevant. The next wave of innovation is set to transform how we collect, analyze, and act on data. Staying informed about these trends is the key to building a future-ready strategy.
Artificial intelligence and machine learning are revolutionizing how organizations get insights from massive datasets. Automated tools can now detect anomalies, predict trends, and even recommend decisions in real time. For example, AI-powered anomaly detection in web analytics helps teams spot unusual patterns before they impact performance. Predictive analytics, using historical and real-time data, allows businesses to anticipate customer needs and market shifts. According to Top Trends Shaping Data-Driven Decision Making in 2025, leveraging these advanced technologies is no longer optional but a necessity for maintaining a competitive advantage.
The rise of no-code and self-service analytics platforms empowers non-technical users to get insights without relying on data scientists or IT teams. These platforms offer intuitive dashboards, drag-and-drop features, and instant visualizations. This democratization of analytics reduces bottlenecks and accelerates decision-making across all levels of an organization. By enabling every team member to get insights from data, companies foster a more agile and responsive culture.
Continuous benchmarking and proactive improvement are becoming standard practice for organizations that want to get insights aligned with industry best practices. Tools now offer real-time comparisons against sector benchmarks, highlighting areas for growth. This approach ensures that strategies remain dynamic and responsive to changing conditions. As outlined in Data-Driven Decision Making: Better Analytics for Business Growth in 2025, businesses that prioritize ongoing learning and tool adoption are better positioned for sustained success.
Comparing Traditional and Emerging Insight Tools:
| Feature | Traditional Tools | Emerging Tools (2025) |
|---|---|---|
| User Interface | Complex, code-heavy | No-code, intuitive |
| AI/ML Capabilities | Limited | Embedded, automated |
| Real-Time Analytics | Delayed | Instant, continuous |
| Benchmarking | Manual | Automated, sector-based |
| Accessibility | Data teams only | Organization-wide |
To get insights that matter in 2025, organizations must embrace these evolving technologies and continually invest in analytics literacy. The future belongs to those who combine advanced tools with a culture of curiosity and adaptability.
As we look ahead to 2025, it’s clear that making smart, data-driven decisions is more important than ever. By focusing on privacy, ethical practices, and actionable insights, you set your organization up for success in a rapidly changing landscape. Swetrix makes this journey smoother by offering intuitive, GDPR-compliant analytics without compromising user privacy or ownership. If you’re ready to elevate your approach and gain real clarity on your website’s performance—all while respecting your users—why not Try Swetrix today and see the difference a privacy-first analytics platform can make for your business